Figure 2.
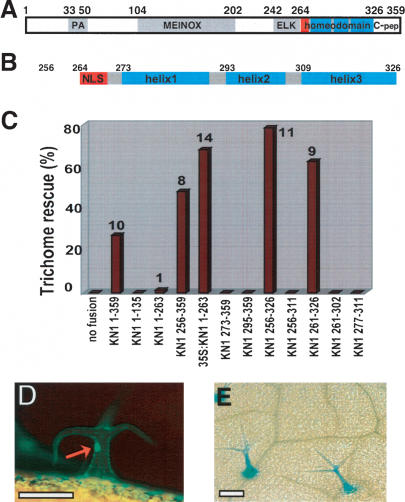
The KN1 homeodomain functions as a trafficking signal domain. (A) Schematic of domains in KN1: peptide antagonist (PA) (Kragler et al. 2000), MEINOX (Bellaoui et al. 2001), ELK (Kerstetter et al. 1994), homeodomain, and C-terminal region (C-pep). Red box indicates nuclear localization signal. (B) The predicted structure of the homeodomain region of KN1. Numbers in A and B indicate amino acids from the ATG. (C) Trichome rescue by different fusions to GL1. Trichome rescue rate (percent of T1 plants showing trichome rescue) is on the Y-axis. The number next to each bar is the average number of trichomes per leaf pair. Note that all constructs are fusions to GL1 driven by the pRbcS promoter, unless labeled “35S”, in which case it is driven by the 35S promoter. (D,E) GFP fluorescence (D) and GUS activity (E) in rescued trichomes of gl1; pGL2::GUS plants containing the pRbcS::GFP∼GL1∼KN1256–359 transgene. Red arrow indicates GFP fluorescence in trichome nucleus. Bars: D,E, 150 μm.

