Figure 2.
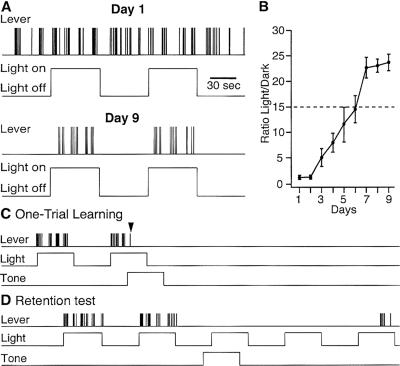
Behavior of a representative cat in Phases 1 (A), 5 (C), and 6 (D). In A, C, and D, the top trace indicates lever presses, and the second trace shows when the lights were turned on and off. The third trace in C,D indicates when the tone was turned on. (B) Progression of lever-pressing rate during Phase 1. Ratio of the number of lever presses in the “lights-on” to “lights-off” periods (y-axis) as a function of time (x-axis). Average of three cats. Dashed lines indicate criterion. When the cats did not press the lever during the “lights-off” period, the ratio was equal to the number of lever presses during the “lights-on” period. Panel C begins after the extended “lights-off” epoch during which the spontaneous activity of BLA neurons was recorded. During the last “lights-on” period, a tone was presented and the animal received a footshock after the first lever-press following tone onset. Upon receiving the shock, the cat stopped pressing the lever. Neuronal recordings resumed after the lights and tone were turned off. (D) Two days later, the cat behaved normally before the tone was turned on, but refrained from pressing the lever for several minutes after presentation of the tone.

