Figure 5.
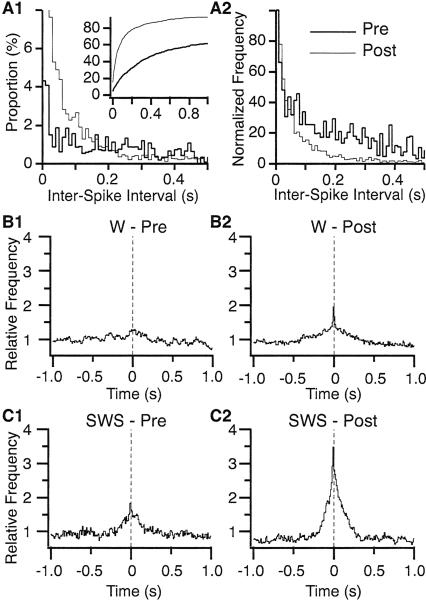
Inter-spike interval (ISI) histograms and cross-correlation of BLA activity. (A) ISI histograms in the waking state before (thick line) vs. after (thin line) the shock. A1, frequency distribution (10-msec bins). Note that the first bin of the post-ISI histogram was truncated for clarity. The true peak was 23%. Inset: Cumulative frequency distribution. A2, same as A1 after normalization so that the histogram peaks are equal. (B,C) Population cross-correlograms of BLA unit activity in W (B) and SWS (C). Cross-correlograms of unit discharges were computed for all available pairs (n = 71) of simultaneously recorded R-cells, and a normalized average was obtained. Left and right columns of panels show activity recorded before and after the shock, respectively.

