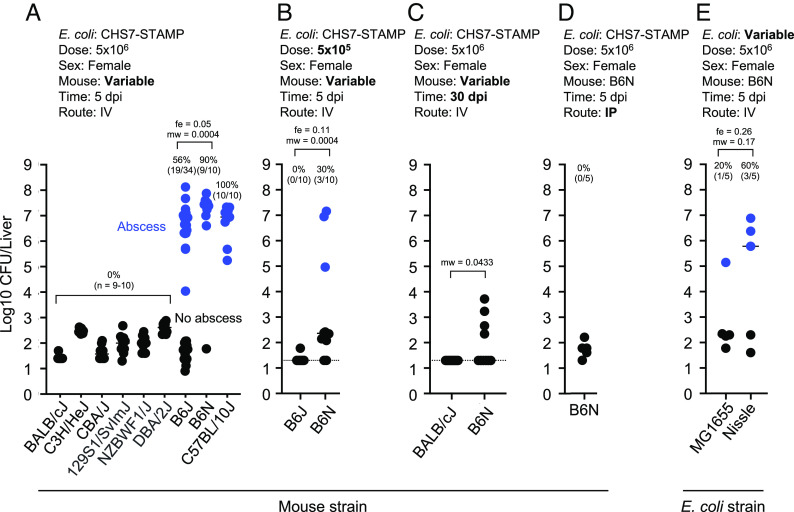
Fig. 2.
Susceptibility to E. coli liver abscess varies in different inbred mouse strains. Blue points represent animals that developed abscesses. Experimental parameters are included above each plot, and bolded text highlights key variable parameters. Abscess frequencies are shown above each group. P values are derived from one-tailed Mann–Whitney U tests (mw) and Fisher exact tests (fe). (A) Abscesses are specific to the C57BL lineage (n = 9 to 10, across 10 experiments). These data were used to define >10,000 CFU and visible abscess formation as criteria for defining abscesses. (B) Differences in infection outcome between B6J and B6N females were also apparent at a lower dose (n = 10, across 2 experiments). (C) Abscesses are cleared by 30 dpi (n = 10). (D) Abscesses do not form in B6N females following IP injection (n = 5). (E) Commensal E. coli MG1655 and Nissle can also stimulate abscess formation (n = 5). Dotted lines in B and C represent limits of detection. P < 0.05 was used to determine statistical significance.

