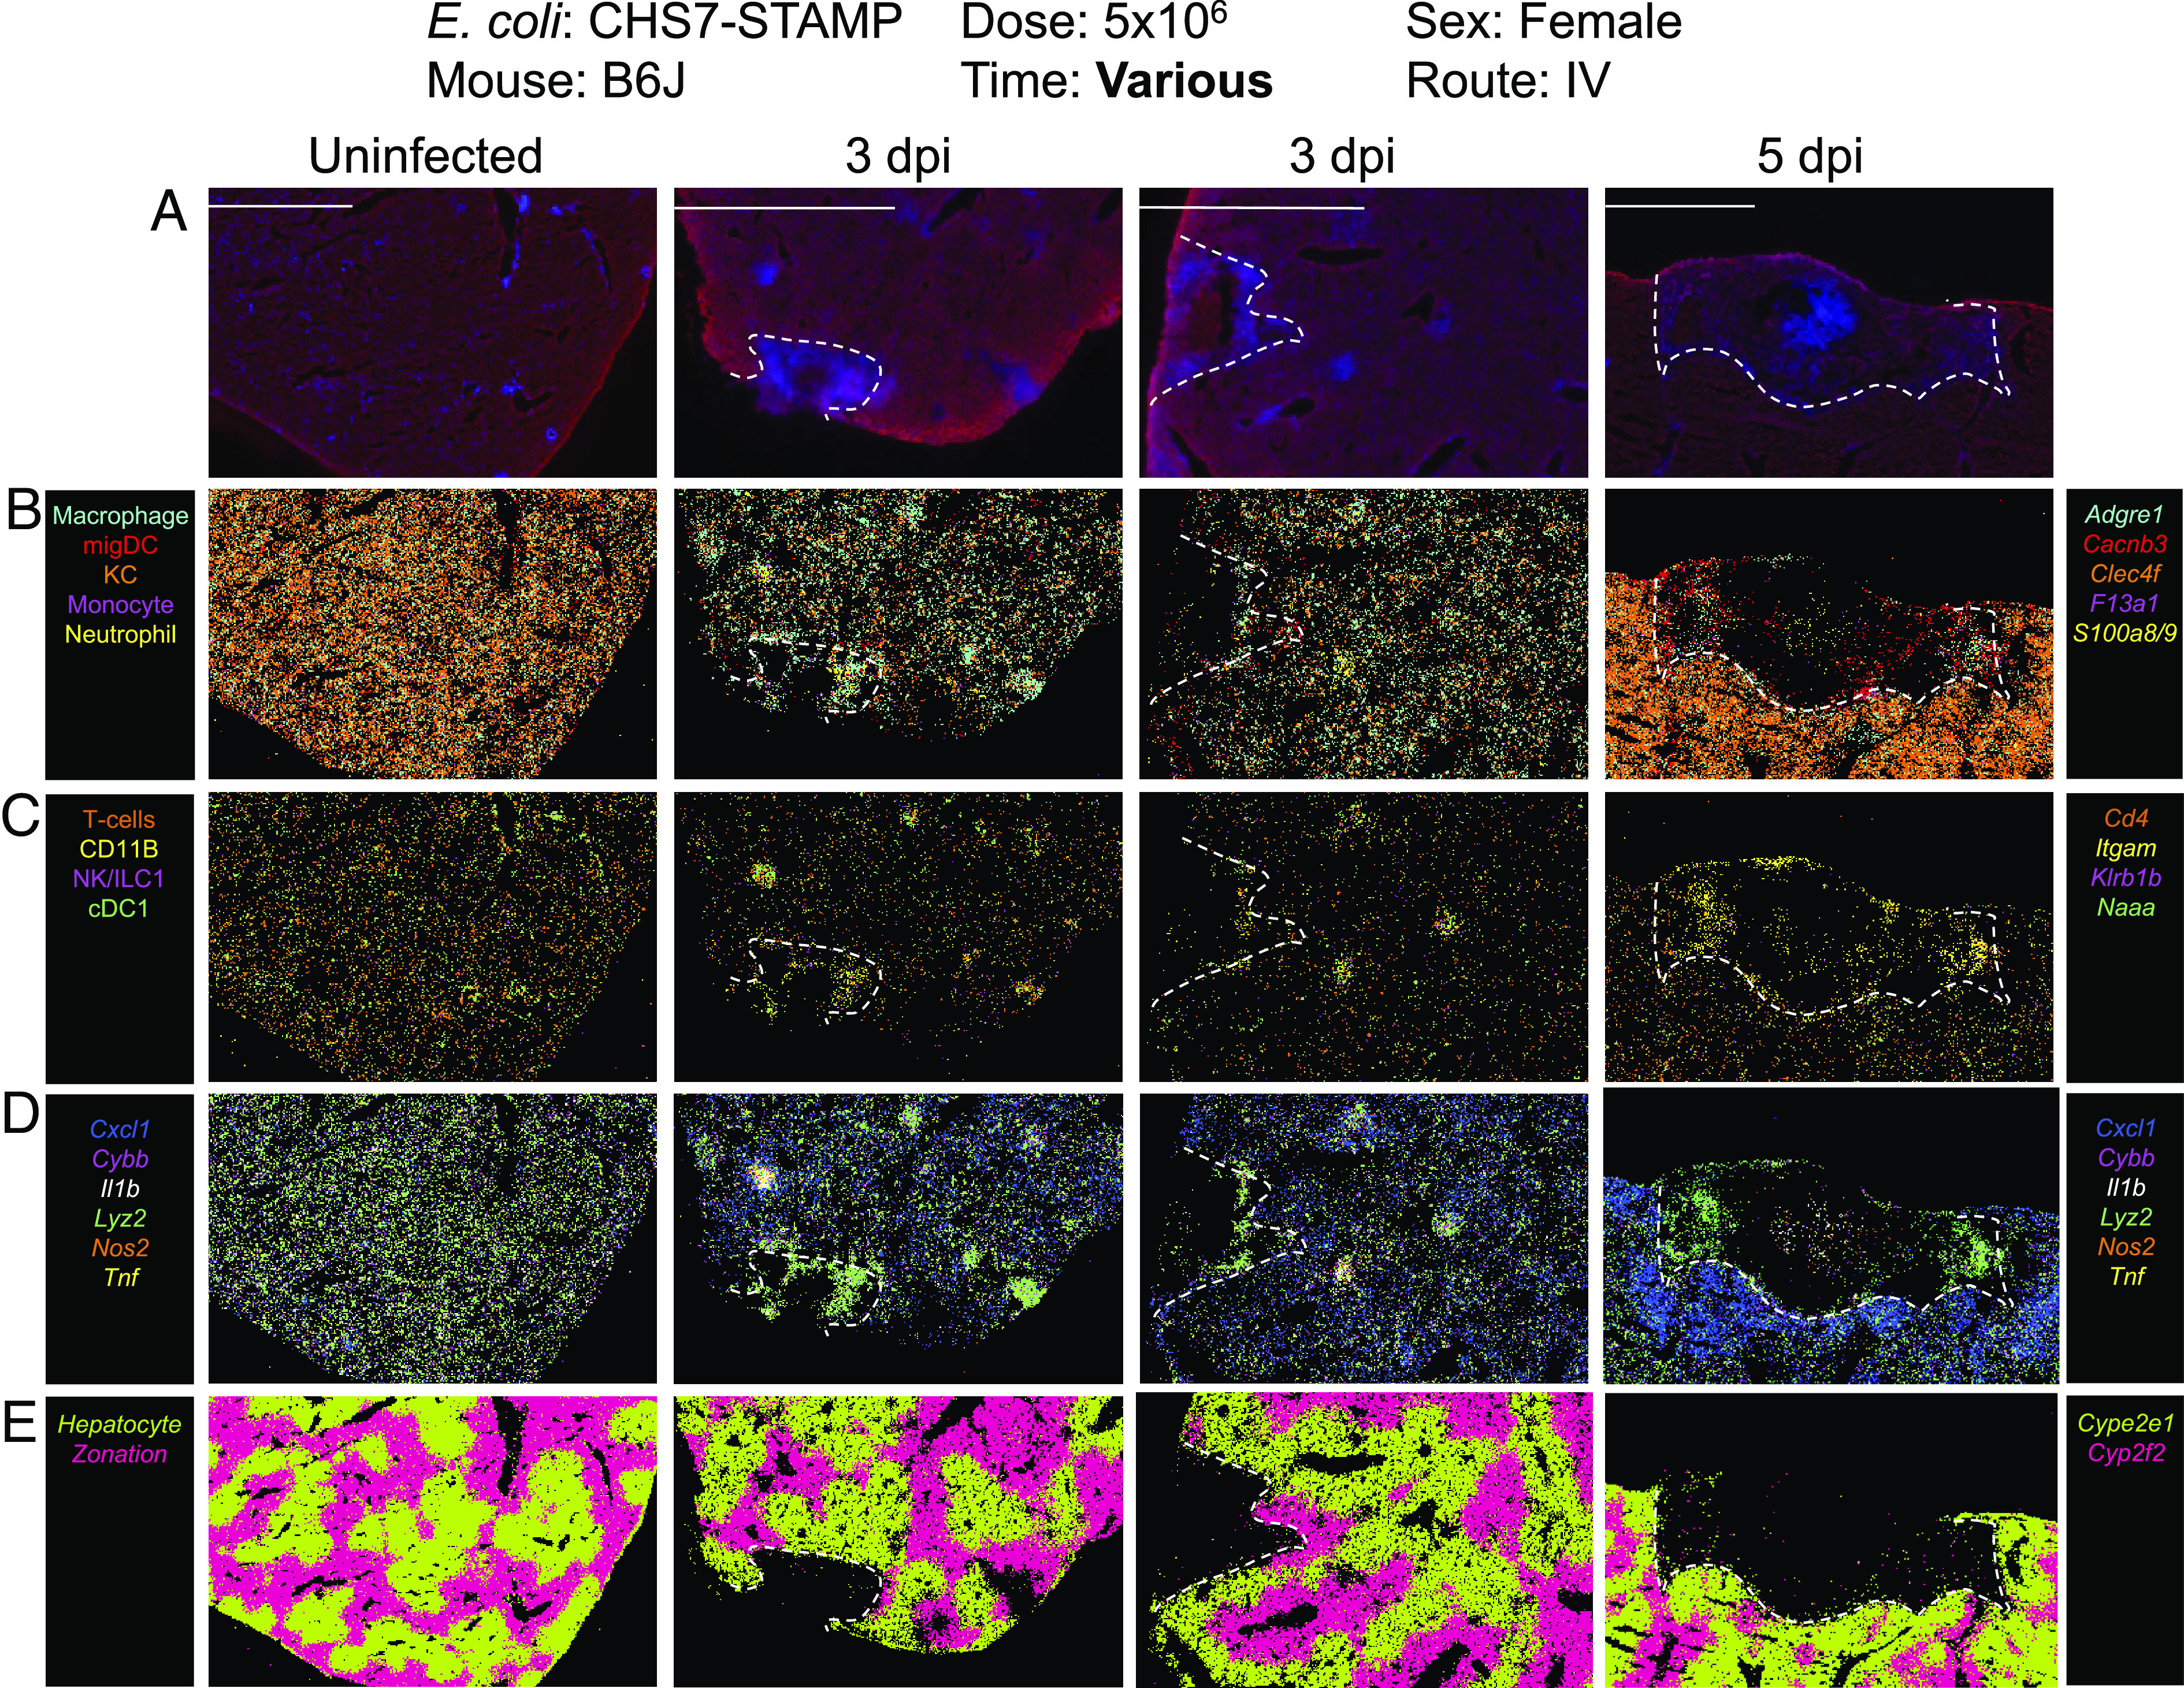
Fig. 3.

Spatial transcriptomic profiles of liver abscesses. MERSCOPE images of liver samples from uninfected, 3 dpi, and 5 dpi mice. Unmerged images are shown in SI Appendix, Figs. S2–S4, and quantification is shown in SI Appendix, Fig. S5. Dotted lines denote abscesses, which coincide with RNA degradation. Transcripts were selected from the liver cell atlas (23), which defines specific cell types associated with each transcript. (A) Abscess boundary and DAPI staining. (B) Macrophages (Adgre1), migratory dendritic cells (Cacnb3), Kupffer cells (Clec4f), monocytes (F13a1), and neutrophils (S100a8/9). (C) T cells (Cd4, also Cd3g, Cd3e, and Cd3b, which were not marked in figure for clarity), NK/ILC1s (Klrb1b), and cDC1 (Naaa). Itgam (CD11b) is a marker for multiple leukocyte subsets, including macrophages, dendritic cells, granulocytes, and NK cells. (D) Markers of inflammation. (E) Markers of liver zonation.
