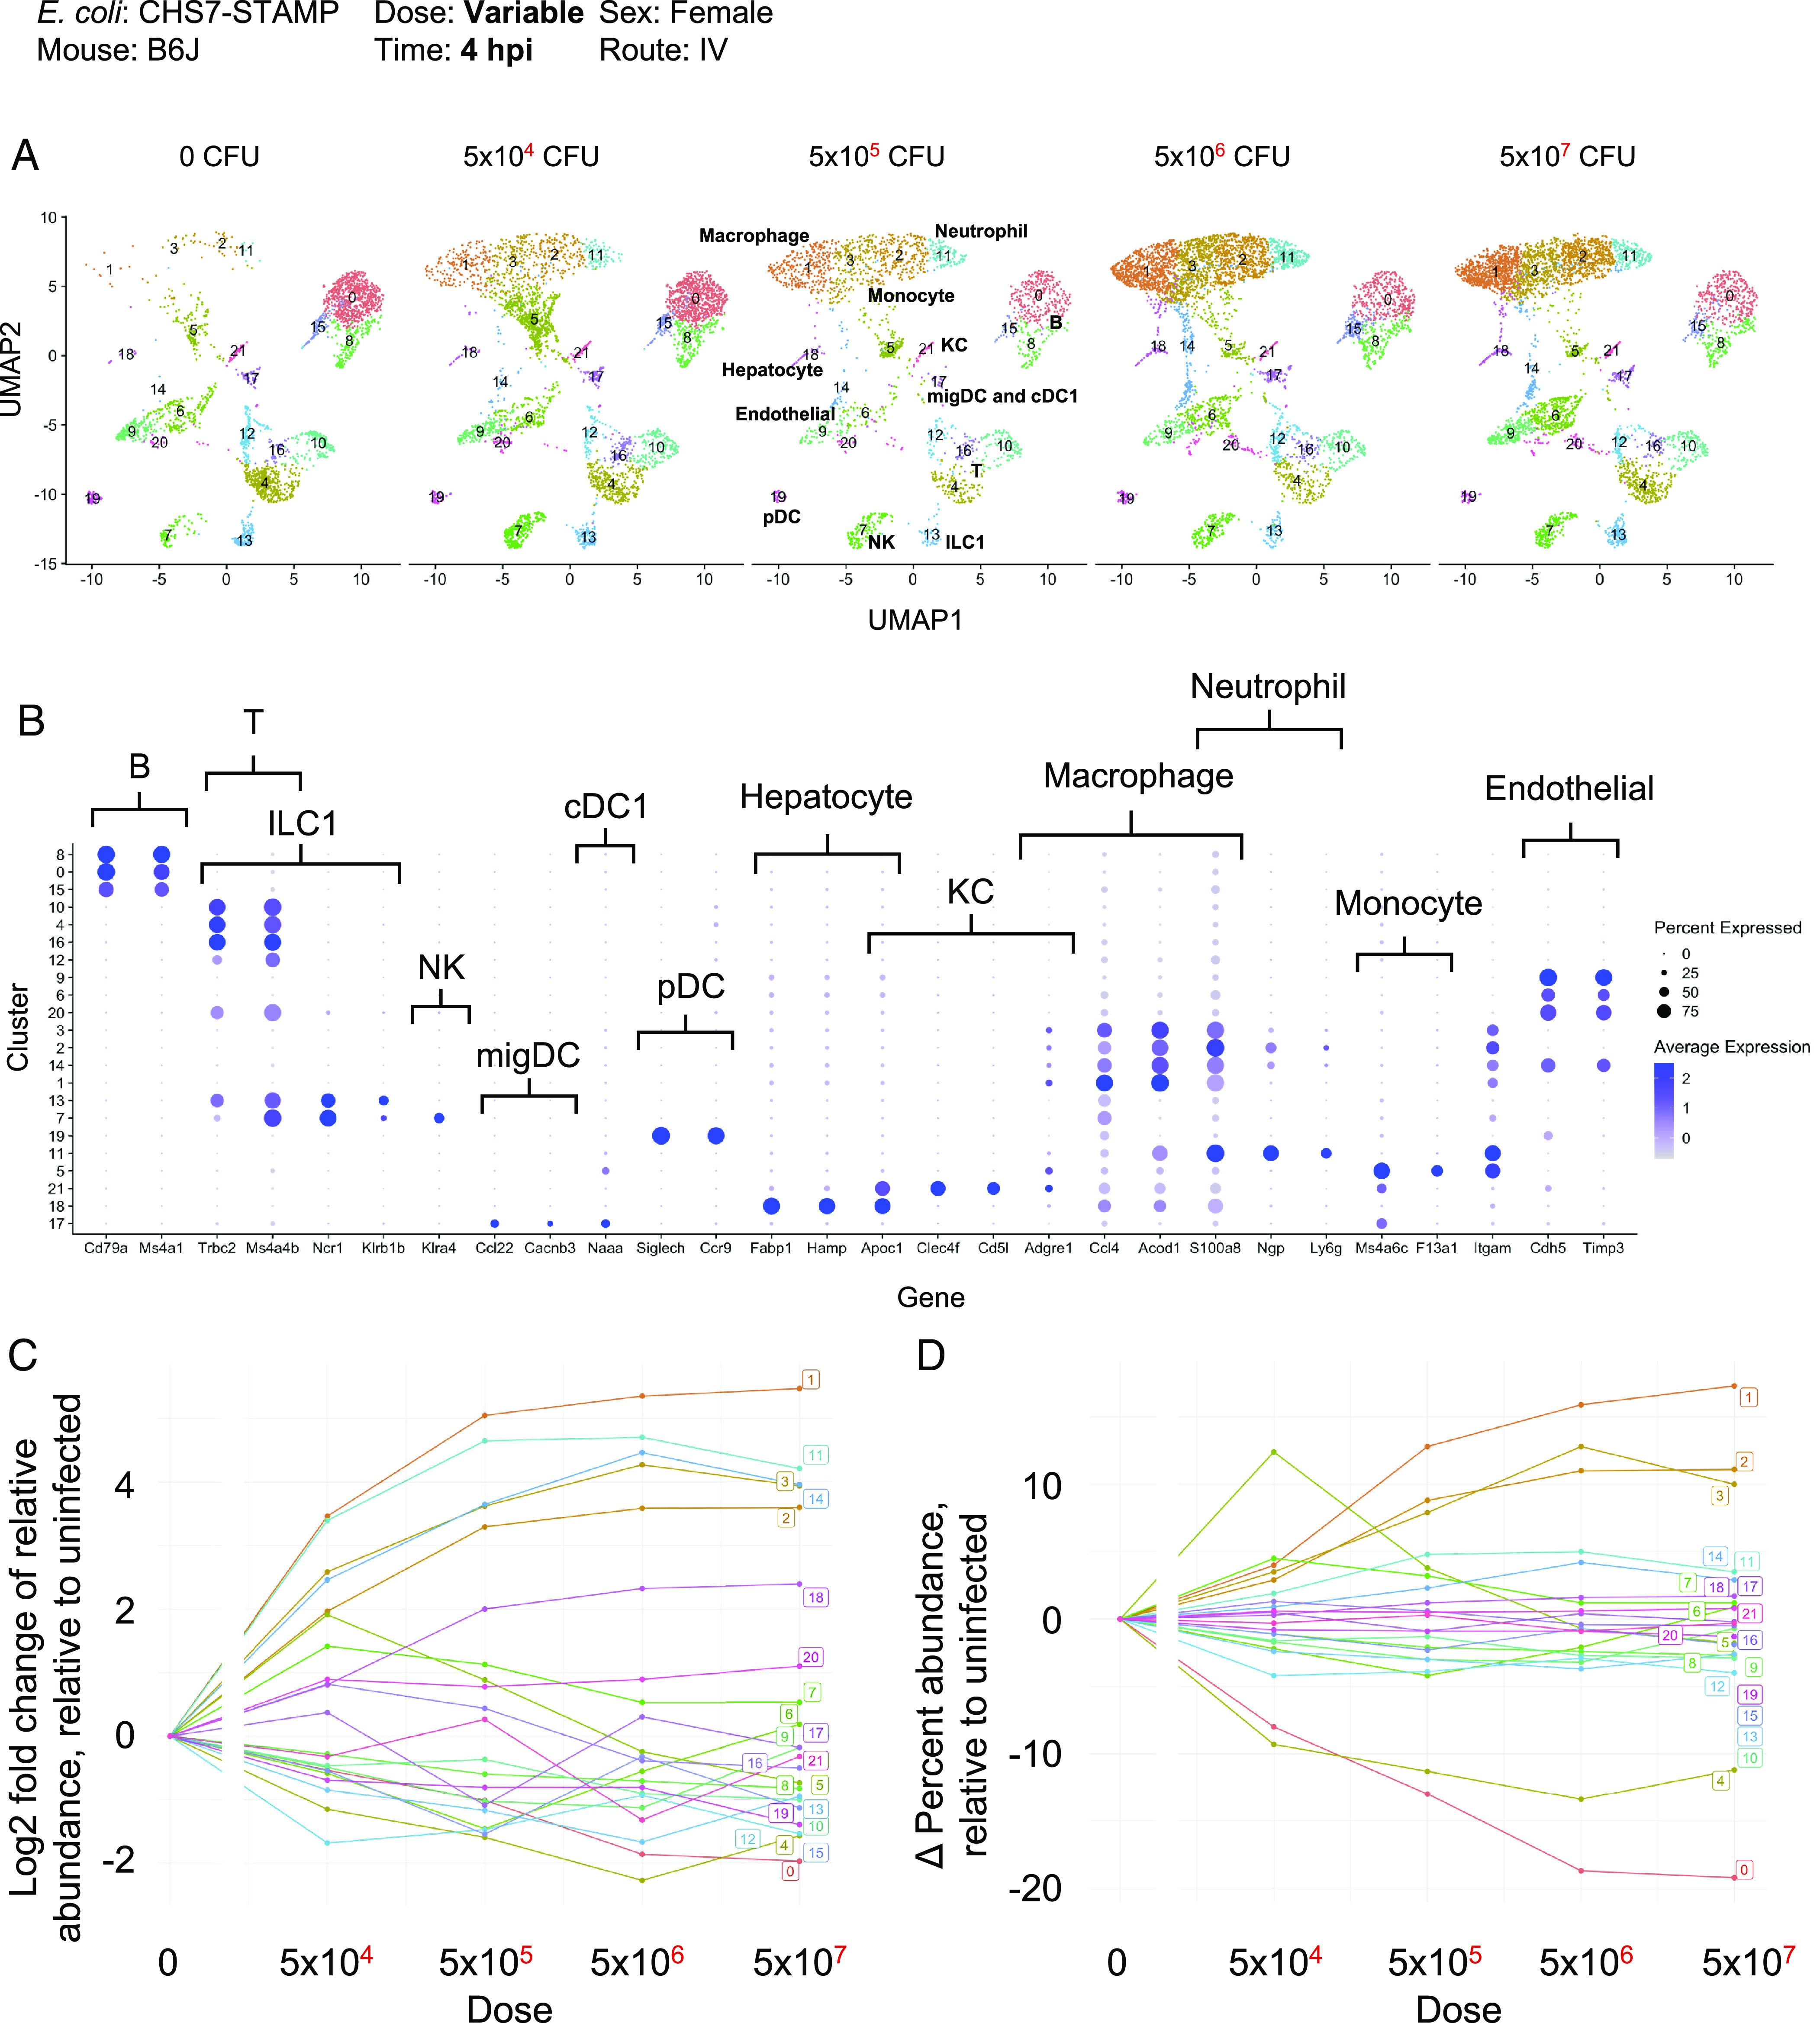
Fig. 6.

Single-cell RNA sequencing of liver immune cells at 4 hpi. (A) UMAP plots from various inoculum sizes from CD45-sorted cells are shown. Infection results in a dose-dependent increase in the infiltration of clusters 1, 3, 2, and 11, corresponding to macrophages and neutrophils. (B) Dot plots from normalized expression values (sctransform) at all doses of select genes used to classify clusters by cell type. (C) Quantification of the fold change of relative abundance of each cluster, relative to uninfected. (D) Same as C but displaying the absolute change in percentage abundance for each cluster, relative to uninfected.
