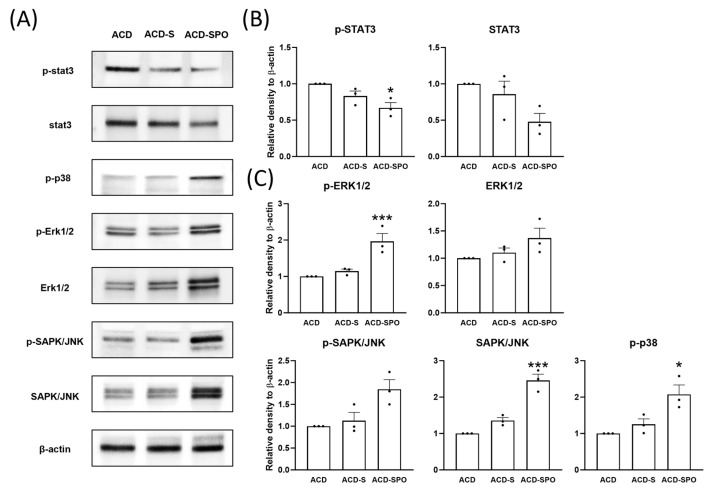
Figure 5.
The modulation of cell signaling pathways in the oxazolone-induced ACD mouse model with OSE treatment. The expression levels of signaling proteins in skin samples from day 21 were analyzed using immunoblotting (A). Quantitative densitometric analysis was performed for the STAT3 signaling proteins (B) and the MAPK signaling proteins (C). All data are plotted and results are presented as mean with SEM. Compared with the ACD group *: p < 0.05, ***: p < 0.001.

