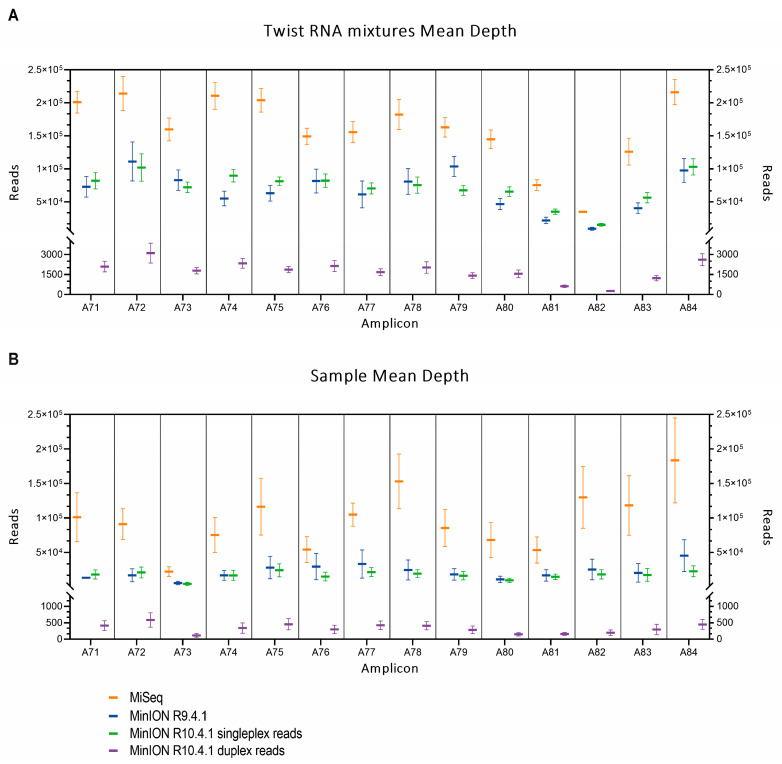
Figure 1.
Sequencing depth observed for each amplicon using MiSeq (orange), MinION R9.4.1 flow cell (blue), MinION R10.4.1 flow cell simplex reads (green), and MinION R10.4.1 flow cell duplex reads (purple), for Twist RNA mixtures (A) and wastewater samples (B). Data represent the average number of reads per amplicon and error bars indicate standard error deviation.

