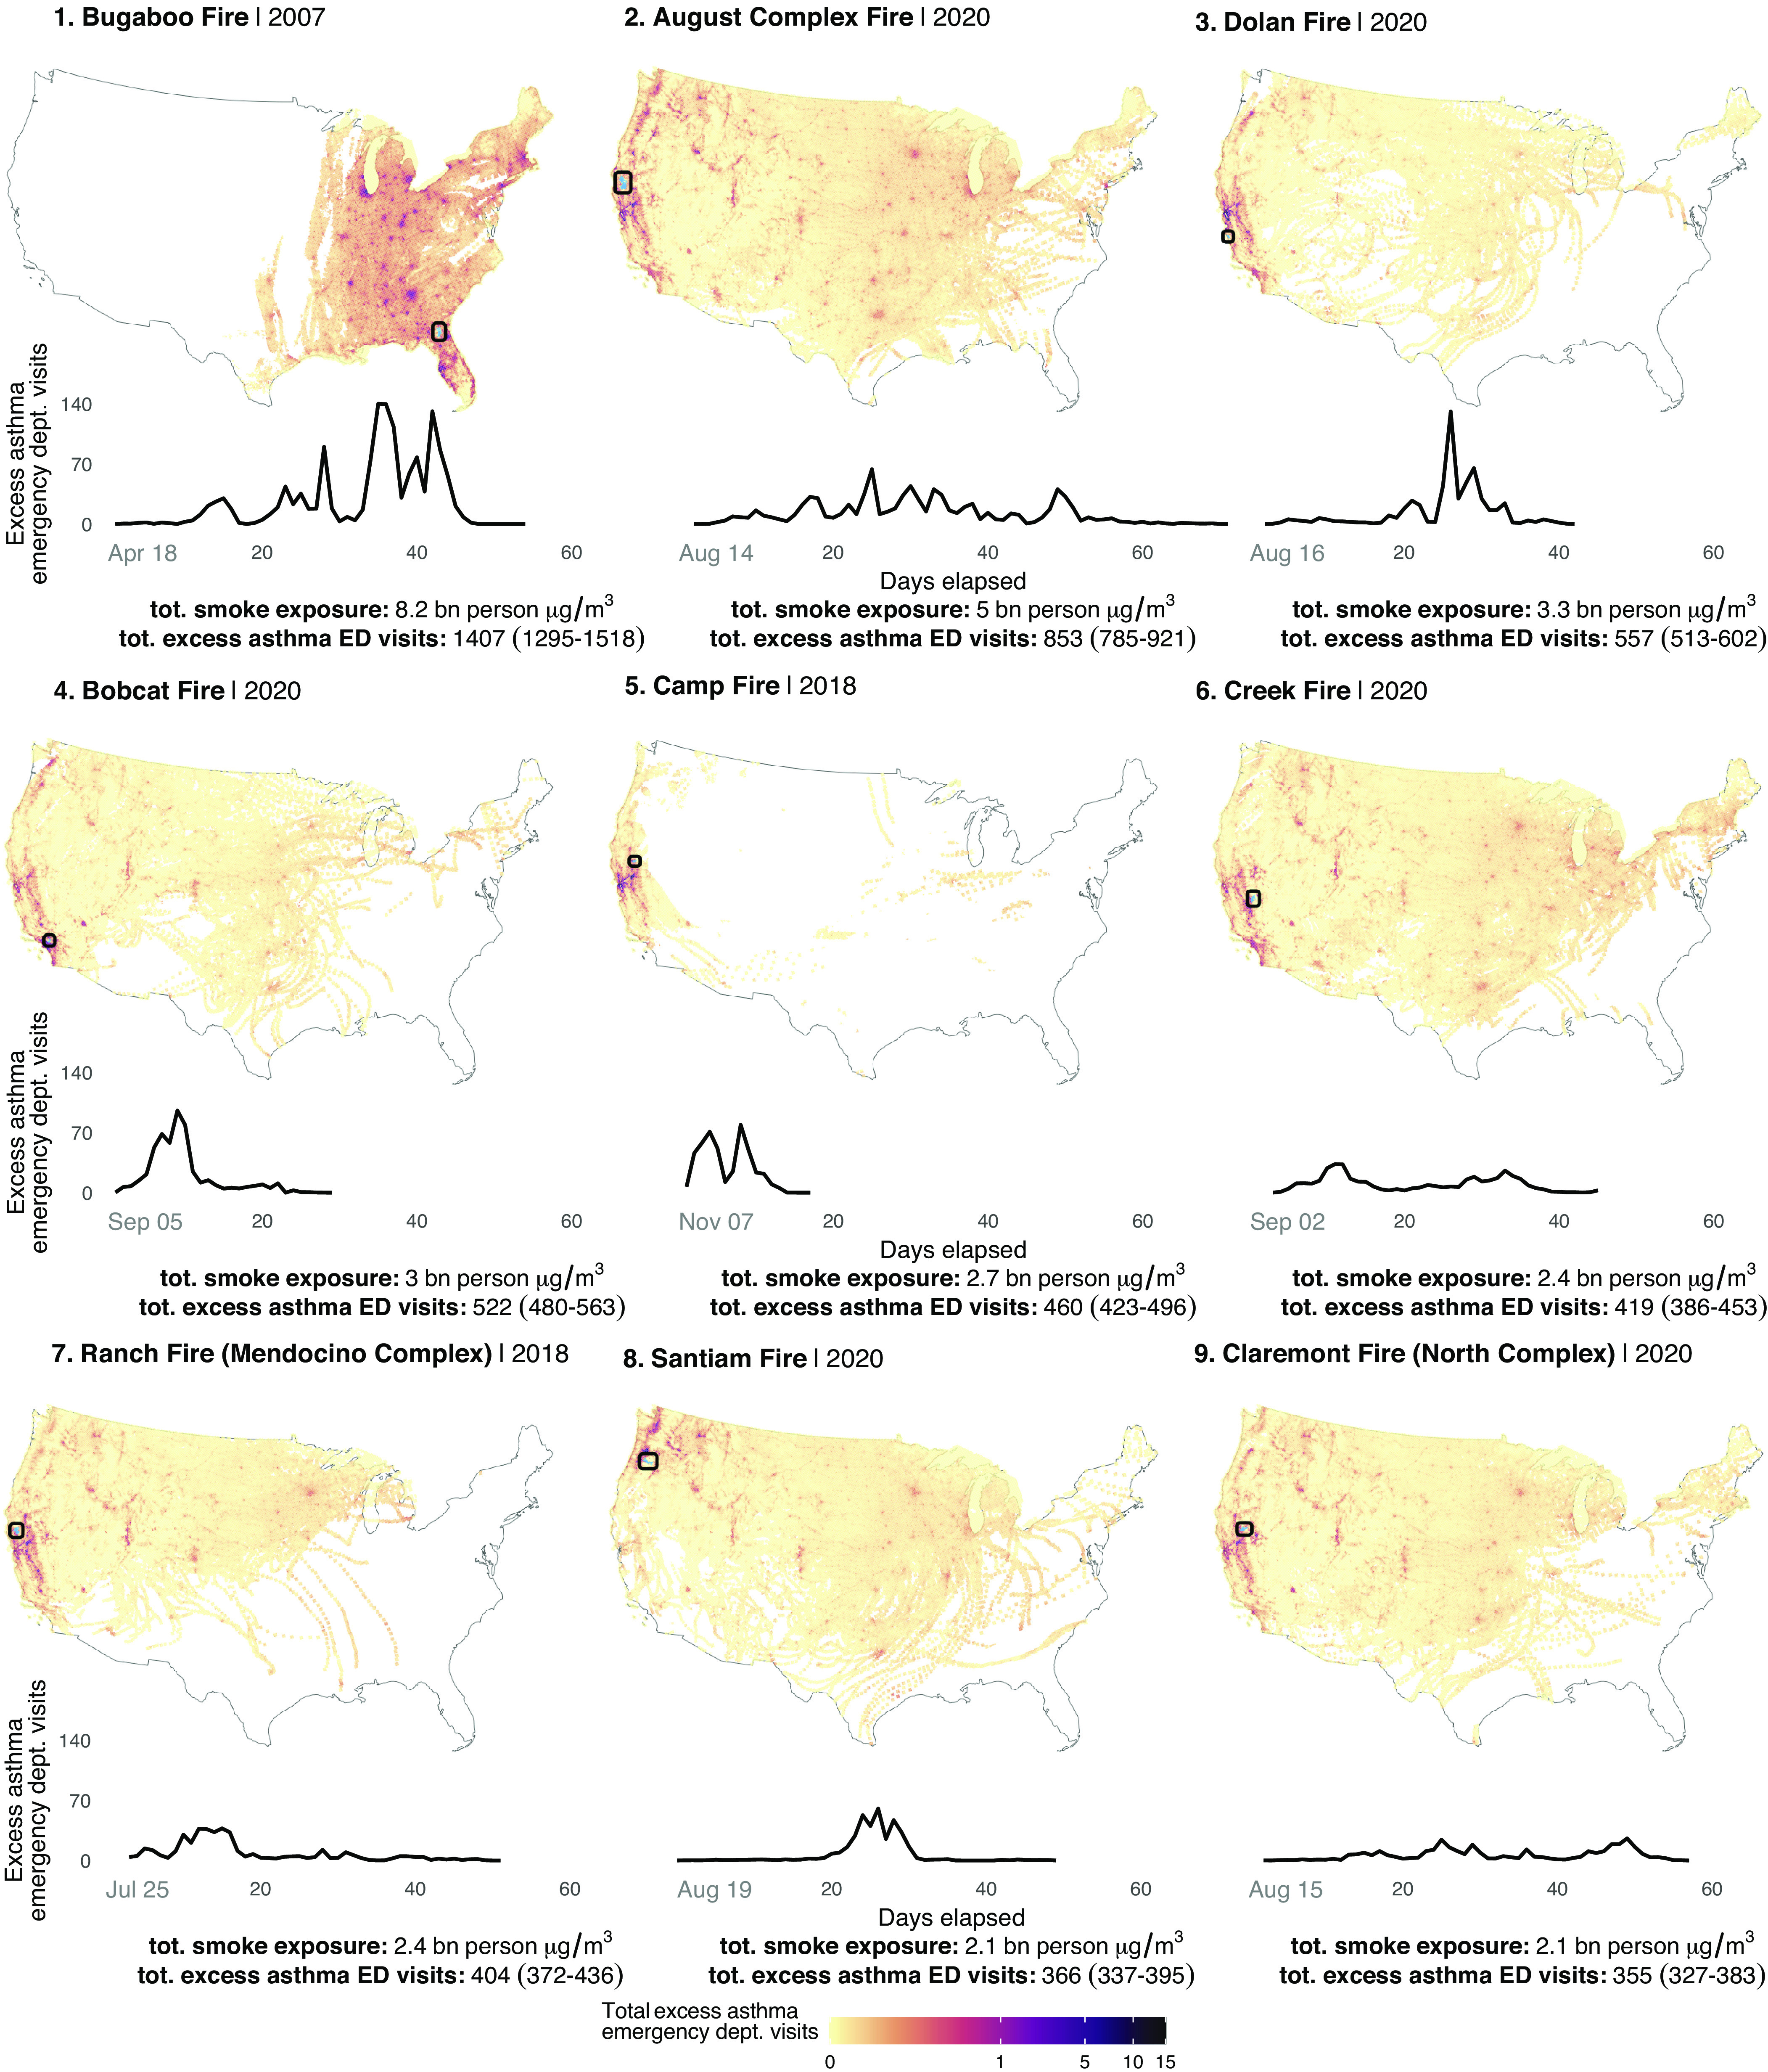
Fig. 3.

Top fires ranked by number of estimated attributable excess asthma ED visits from April 2006 to 2020. Each small multiple map shows the total health impacts measured by the number of excess asthma ED visits from wildfire smoke PM2.5 aggregated over the duration of the fire (with 95% confidence interval in parentheses). This estimate considers the amount of smoke PM2.5, the population affected, and the total number of days of smoke exposure. The line chart shows the estimated asthma-related ED visits from smoke PM2.5 over time from the initial day of the fire. Initial fire locations are cyan colored and outlined in black.
