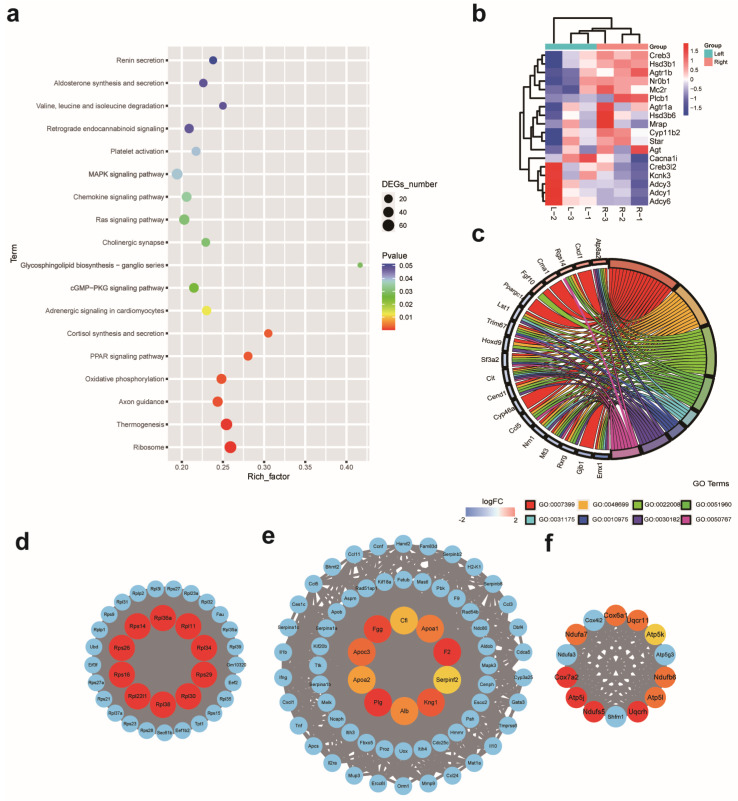
Figure 3.
Transcriptional sequencing analyses between the left and right adrenal glands in mice. Significantly enriched KEGG pathways (a), heatmap of DEGs in the KEGG pathway “Corticosterone synthesis and secretion” (b), and chord plot containing significantly enriched GO terms related to nervous system development (c). Major protein–protein interaction network and top 10 hub genes in each network (d–f). The node color changed gradually from yellow to red in ascending order, according to the maximal clique centrality of the node.

