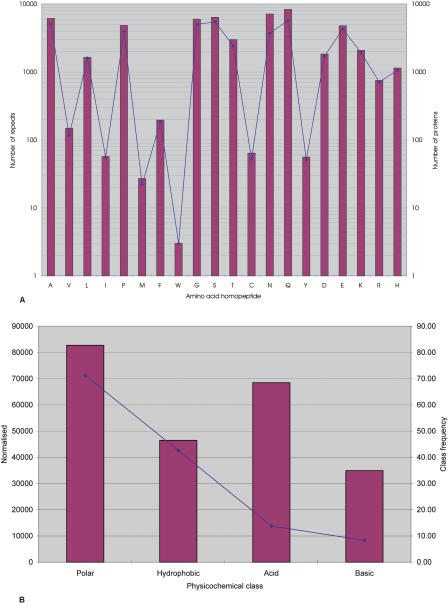
Figure 1.
Distribution of RCPs in GENPEPT. (A) The distribution of the RCPs in GENPEPT and the total number of repeats in GENPEPT. The bars represent the total number of repeats and the solid diamonds the number of RCPs. (B) Distribution of the repeats based on physicochemical class (polar, hydrophobic, acidic, and basic). Red bars represent the number of repeats for the amino acid class normalized for the amino acid frequencies in GENPEPT for that amino acid class (i.e., number of repeats in class X/[amino acid frequency for class X, not including the RCPs]). The solid blue diamonds represent frequency of the amino acid class in the RCPs.

