Figure 2.
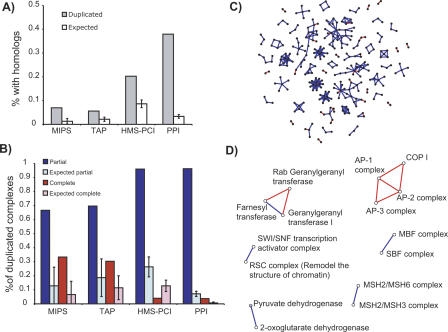
Extent of duplication of complexes in the three data sets and in pairwise protein interactions. (A) Proportion of complexes which have at least one homologous complex in each of the data sets. This includes both partial and complete duplications. The PPI column represents the proportion of pairwise protein interactions that are partial or complicate duplicates of another pairwise interaction. For both the protein complexes and pairwise protein–protein interactions, each complex or interaction is counted as a partial duplicate if it has both shared and homologous components to another complex or pairwise interaction. A complex is classified as a complete duplicate only if there is no partial duplicate to it. Expected values are shown as white bars. (B) Proportion of the complexes with homologs that can be classified as a partial (blue) or complete (red) duplication for the three protein complex data sets, and the pairwise protein–protein interactions (PPI). Expected values are shown as light-shaded bars. (C) Network representation of the subset of the yeast protein–protein interaction network where interactions have been produced by duplication, colored according to the type of duplication. Red edges indicate interactions that have completely duplicated, and blue edges indicate interactions where only one of the components has duplicated and inherited the interaction (partial duplication). (D) Network representation of duplicated complexes in the MIPS data set. Nodes correspond to complexes and edges to homologies between complexes. Blue edges represent concurrent complexes (partial duplication), whereas red edges denote parallel complexes (complete duplication). Network layout performed with Java BioLayout (Enright and Ouzounis 2001).

