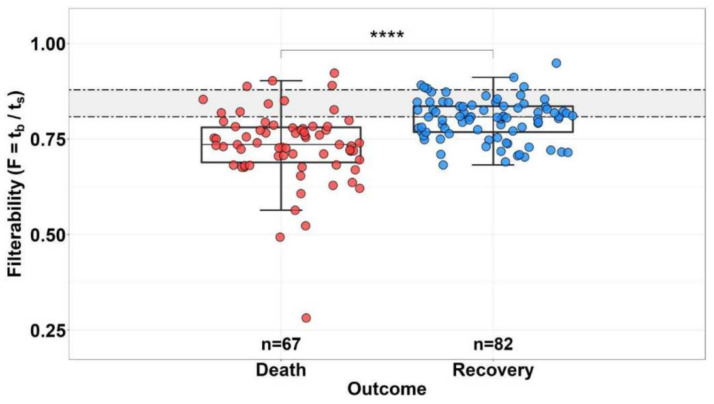
Figure 1.
Distribution of RBC filterability in the group of deceased (n = 67) and survivor (n = 82) patients with COVID-19. Horizontal dotted lines indicate the boundaries of normal filterability values. **** The difference between the groups is significant (p < 0.0001). Reproduced from [27].

