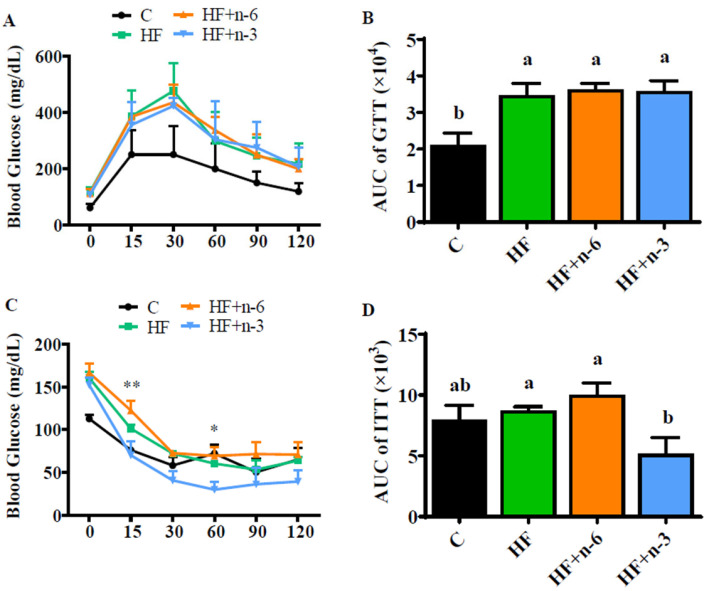
Figure 2.
The differential effects of a high-fat diet rich in n-6 PUFAs or n-3 PUFAs on glucose homeostasis. The glucose tolerance test (GTT) and insulin tolerance test (ITT) were conducted after the mice had been switched to intervention diets for 8 weeks. (A) The levels of glucose at different time points during GTT. (B) The area under the curve is calculated according to the plot of GTT. (C) The levels of glucose at different time points during ITT. (D) The area under the curve is calculated according to the plot of ITT. Values represent mean ± S.E.M. Error bars represent S.E.M., and different letters indicate significant difference. * p < 0.05, ** p < 0.01, represents significant difference between HF+n-3 and HF.

