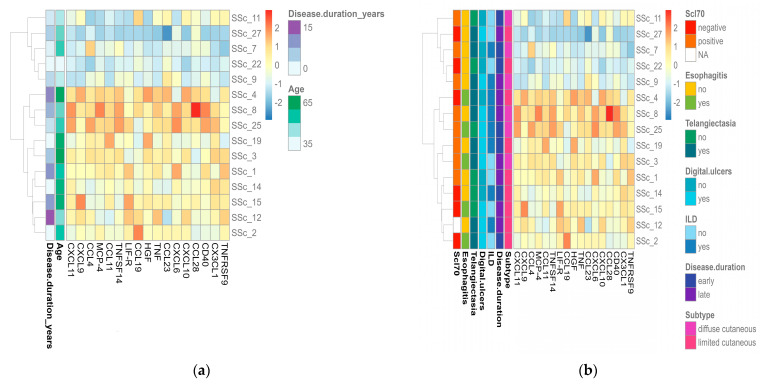
Figure 2.
Visual representation of SSc endotypes in relation to protein abundances and clinical characteristics. (a) Heatmap of significantly upregulated inflammatory proteins in patients with SSc according to age and disease duration. (b) Heatmap of significantly upregulated inflammatory proteins in patients with SSc according to disease subtype, internal organ involvement, and laboratory features. Columns represent individual proteins, while rows represent individual samples. Row and column dendrograms show the distance/similarity between the variables. The relative value for each protein is shown based on the color intensity of the Z-score, ranging from low (blue) to high (red).

