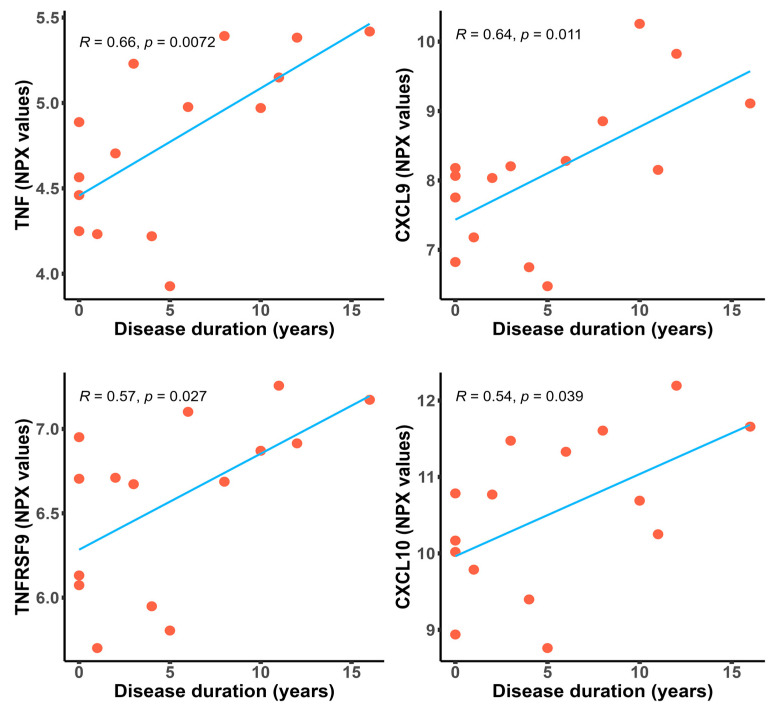
Figure 3.
Scatter plots depicting positive correlations between the NPX values of significantly expressed proteins and disease duration in patients with SSc, with the Pearson’s correlation coefficient. The fitted linear regression line of each scatter plot (blue) is depicted along with the R and p-values.

