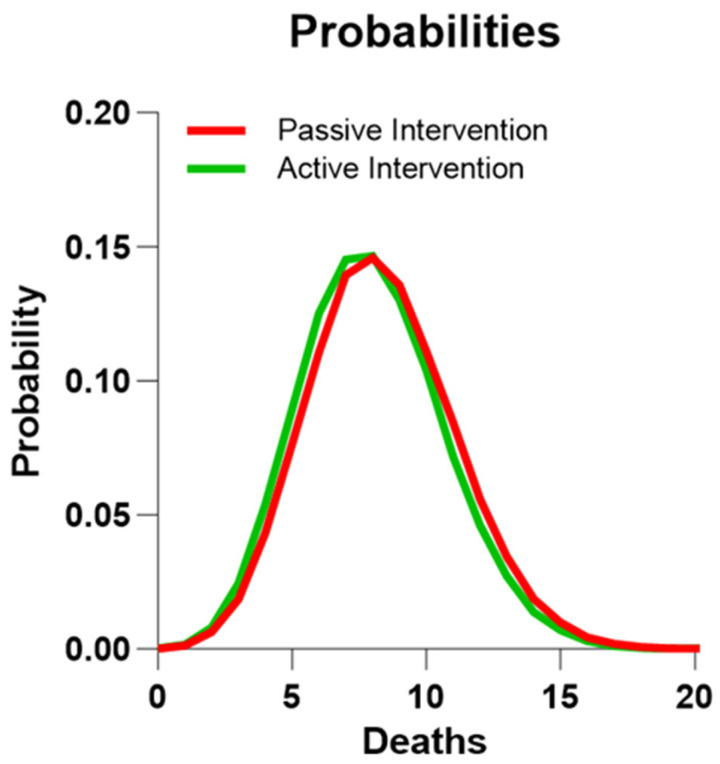
Figure 4.
Predicted distributions of deaths in RCT groups. Distribution of probabilities of number of deaths during the 5-year observation period in two groups with regard to the RCT active intervention and passive intervention groups, respectively, when they are matched to the general Danish population for gender, age, and observation period.

