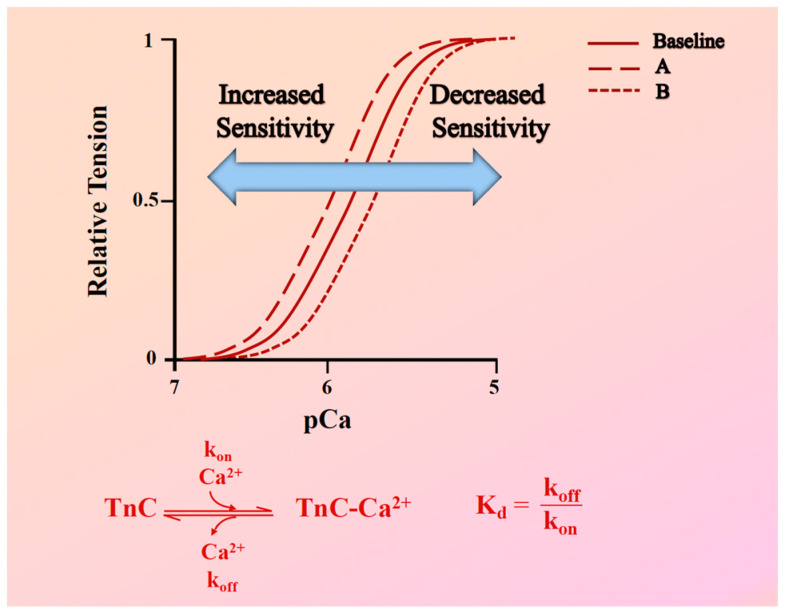
Figure 1.
Assessment of myofilament Ca2+ response variability. Top: Force-pCa2+ relationship curves showing variations in myofilament Ca2+ sensitivity. The solid line represents the baseline force-Ca2+ relationship. Curve (A) demonstrates increased Ca2+ sensitivity, indicated by a leftward shift, where a given steady-state force is achieved at lower Ca2+ concentrations. Curve (B) demonstrates decreased Ca2+ sensitivity, indicated by a rightward shift, requiring higher Ca2+ concentrations to generate the same steady-state force. Bottom: This panel shows a biochemical representation of the Ca2+ binding dynamics to Troponin C (TnC). It includes the calcium association rate (kon) and dissociation rate (koff) from TnC, alongside a formula illustrating the relationship between the equilibrium dissociation constant (Kd), kon, and koff.

