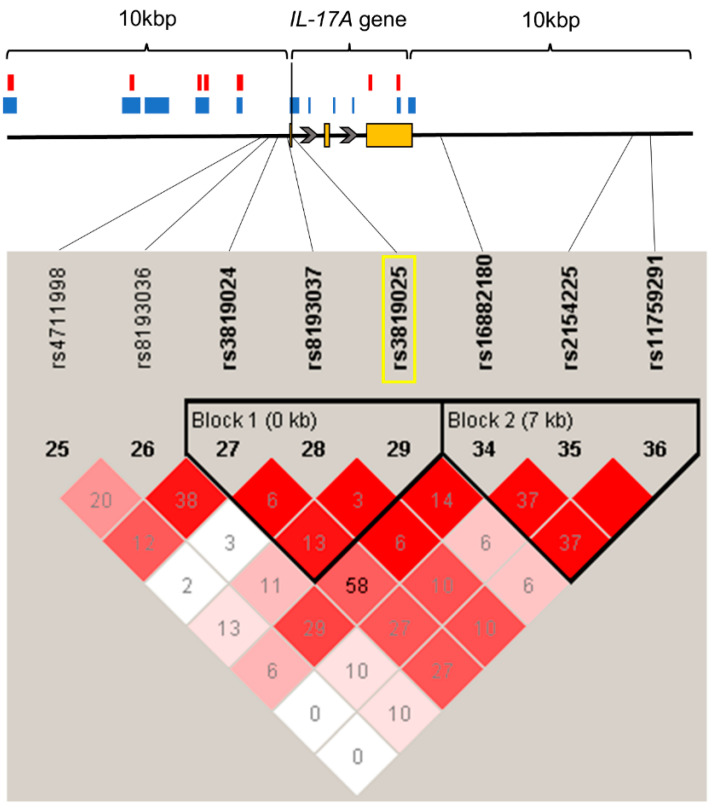
Figure 2.
State of LD among SNPs in the IL-17A gene region, including 10 kbp upstream and downstream (LD Plot-r2). Numbers in squares that two SNPs face represent the percentage of r2 values that were calculated from genotype data of the SNPs. The white boxes represent D′ < 1 and log of the likelihood odds ratio (LOD) < 2. The shades of pink or red boxes represent D′ < 1 and LOD ≥ 2. The blue boxes represent D′ = 1 and LOD < 2. The bright red boxes represent D′ = 1 and LOD ≥ 2. The solid horizontal line above the LD plot represents the IL-17A gene, including 10 kbp upstream and downstream of the gene. The orange boxes represent exons, and solid lines represent untranslated regions or introns in the IL-17A gene structure. The gray arrows represent the direction of transcription. The yellow rectangle represents the SNP on which we focused in this study. The red boxes represent the enhancer regions by DHS. The blue boxes represent open chromatin regions with DNase-Seq signals (p-value signal ≥ 2). The black vertical line represents the location of the rs3819025 SNP.

