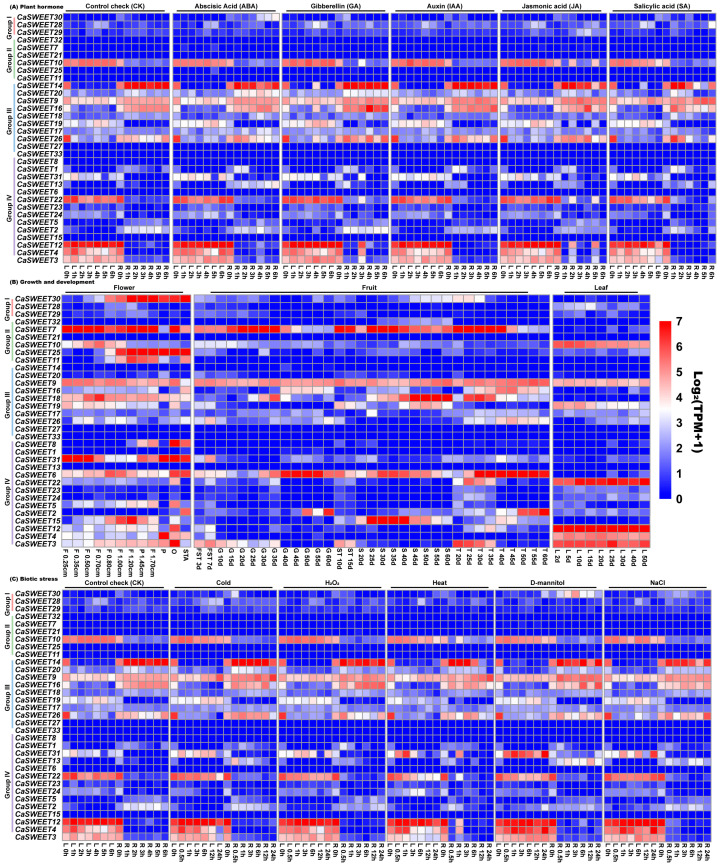
Figure 7.
CaSWEET expression patterns under plant hormones, growth, and development, as well as abiotic stress treatments. Different colors in the legend represent different log2(TPM + 1) values, red represents the largest log2(TPM + 1) value, and blue represents the smallest value. CK: control (no further treatment); L: leaf; R: root; F: flower bud (cm is the length of the flower bud); P: perianth when flowers are fully open; O: ovary when the flower is fully open; STA: anther when the flower is fully open; FST: fruit; S: seed; T: placentation; ST: young seeds and placentation.

