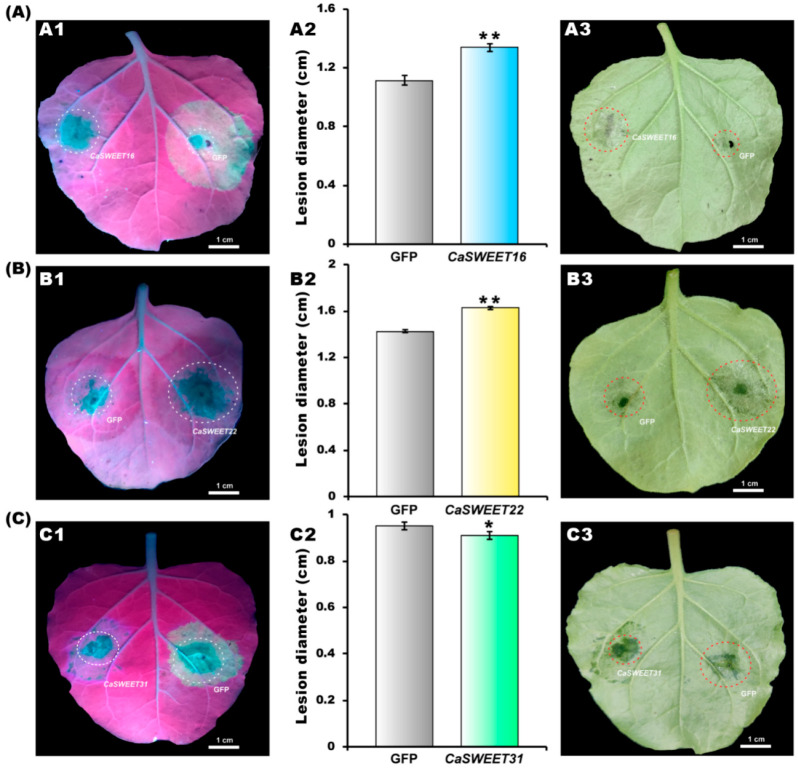
Figure 10.
Influence of (A1,A3) CaSWEET16, (B1,B3) CaSWEET22, and (C1,C2) CaSWEET31 on disease resistance of N. benthamianaleaves. (A2,B2,C2) Statistical analysis of lesion diameter. Error bar represents standard deviation (SD). * Represents the significant level at p < 0.05, and ** represents the significant level at p < 0.05.

