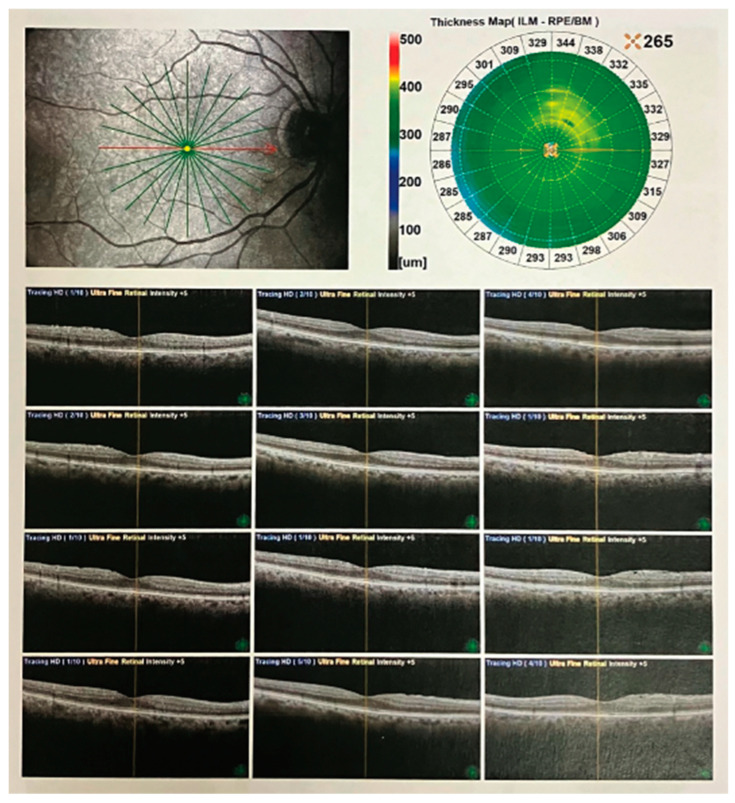
Figure 3.
OCT radial scans of the macula in a patient with epiretinal membrane. SD-OCT images using a Nidek Optical Coherence Tomography (OCT) RS-3000 instrument. The OCT results show radial scans (indicated with the green lines) capturing the intricate microstructural details of the macula in a patient diagnosed with epiretinal membrane. The image displays a cross-sectional view of retinal layers (at the level of the macula indicated with the red line), showcasing the impact of the membrane on the retinal architecture. Prominently featured are disruptions in the inner retinal layers, including the macular fovea, and the distinct hyper-reflective band corresponding to the epiretinal membrane itself. This high-resolution OCT analysis provides valuable insights into the pathological changes associated with epiretinal membrane formation, aiding in the clinical assessment and management of retinal disorders.

