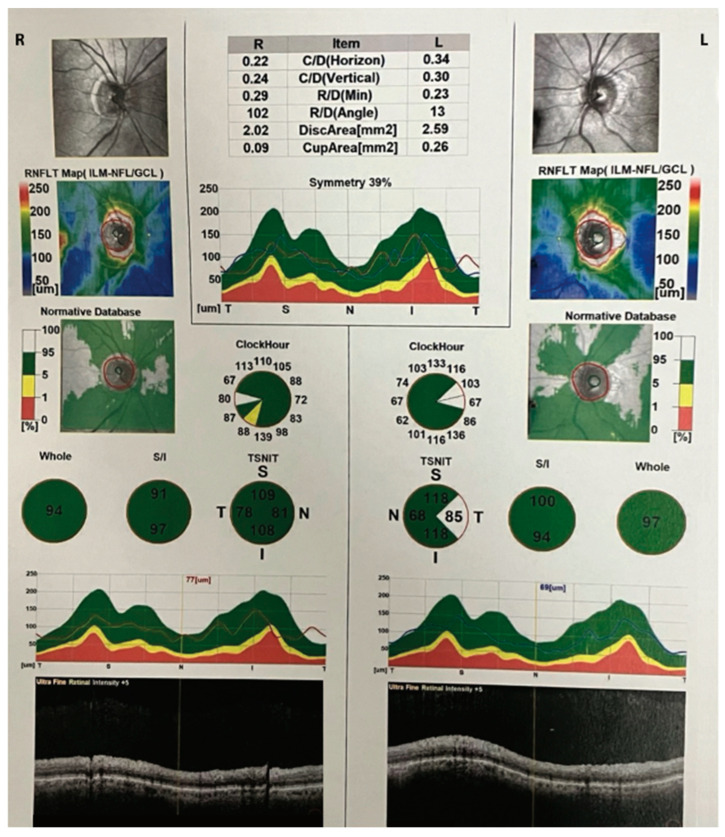
Figure 5.
OCT scans showing retinal nerve fiber layer (RNFL) thickness values in clockwise sectors for both eyes. SD-OCT images using a Nidek Optical Coherence Tomography (OCT) RS-3000 instrument. The sections indicated in green are within normal limits compared with the normative age-related database. Yellow sections are considered borderline, while red is indicative of defective areas The OCT image depicts the peripapillary region, highlighting a subtle reduction in the thickness of the retinal nerve fiber layer (RNFL) in the inferior sector of the right eye, which is depicted in the yellow pie-shaped triangle above. The left eye is normal. The color-coded thickness map indicates a localized decrease in RNFL thickness, represented by the yellow, particularly in the inferior region surrounding the optic nerve head. This minor thinning of the peripapillary RNFL may suggest a subtle alteration in the nerve fiber layer density, which may have implications for visual function and requires close clinical monitoring. The precise mapping provided by OCT enables a detailed assessment of RNFL thickness, contributing valuable information to the early detection and management of subtle structural changes in the optic nerve head, which is important in patients with ocular hypertension and glaucoma.

