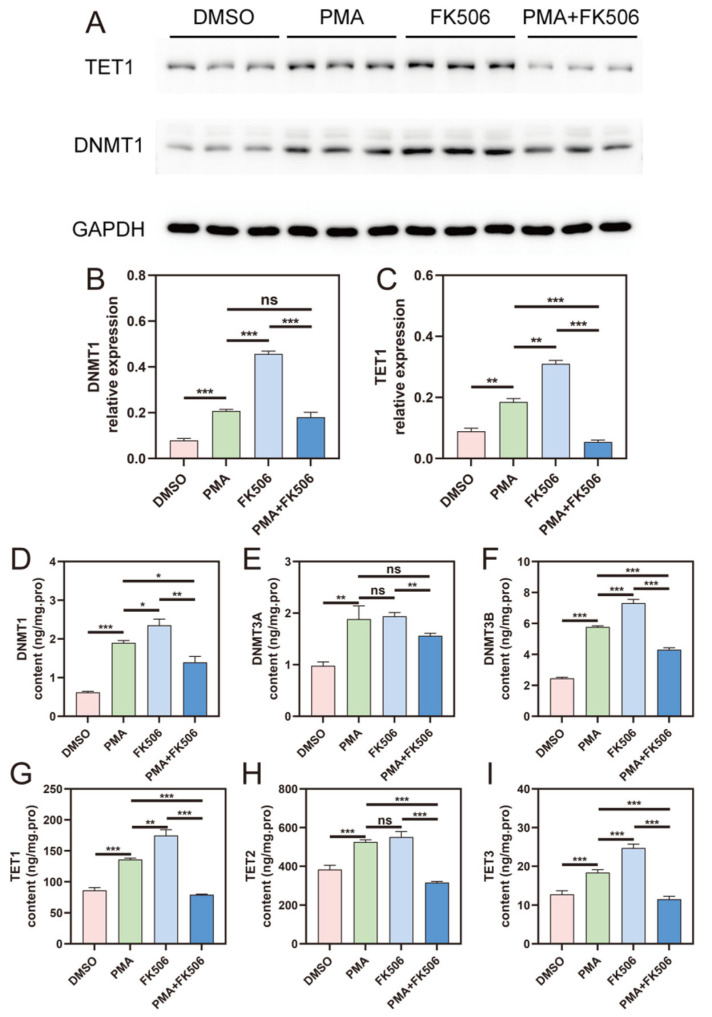
Figure 4.
The gene expression of DNMTs and TETs in the four groups of cells. (A) Western blot picture of TET1 and DNMT1 in the four groups of cells. Western blot data of (B) DNMT1 and (C) TET1 expression levels. (D–I) The protein content of DNMT1, DNMT3A, DNMT3B, TET1, TET2, TET3, respectively. ns indicates no significant difference, * indicates p < 0.05, ** indicates p < 0.01, *** indicates p < 0.001. n = 3.

