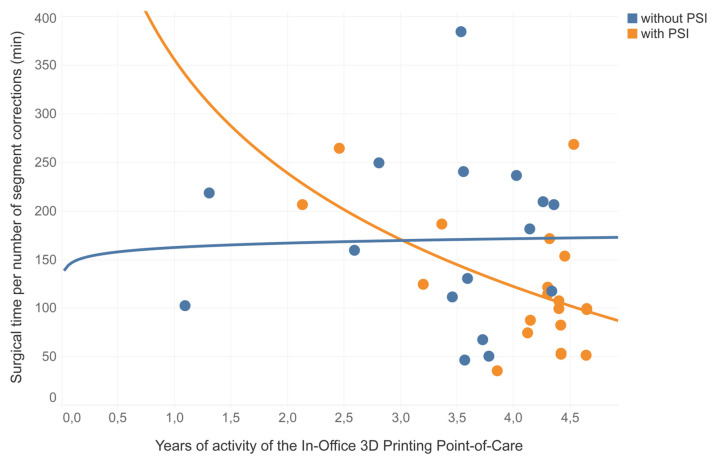
Figure 10.
Representation of logarithmic correlations of the surgical time per number of segment corrections, distribution of femur and tibia corrections during the clinical trials years, divided between procedures performed without PSIs (in blue) and procedures performed with PSIs (in orange). PSIs = Patient-Specific Instruments produced in the In-Office 3D Printing Point of Care; min = minutes.

