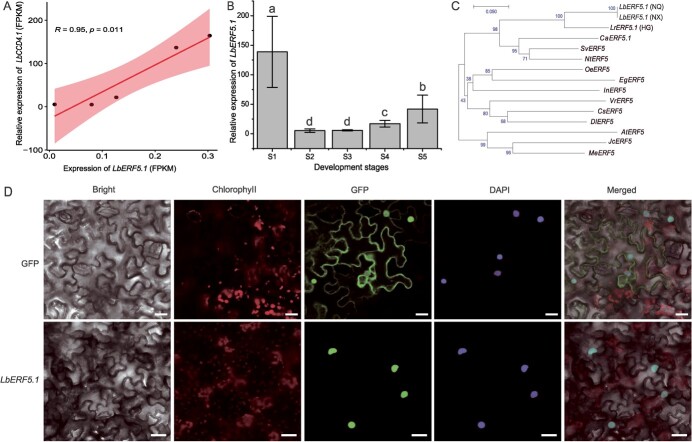
Figure 3.
Identification of LbERF5.1. A Correlation between LbCCD4.1 and LbERF5.1 expression levels in NQ fruit at five key developmental stages. B Expression profile of LbERF5.1 in NQ fruit at five key developmental stages. Multiple comparative analyses were performed using one-way ANOVA and Tukey’s multiple range test (P < 0.05). C Evolutionary tree analysis of ERF5.1 in 14 diverse species. The evolutionary tree was constructed using the Neighbor Joining method of MEGA7 with bootstrap = 1000. D Subcellular localization of LbERF5.1 in tobacco leaves. Scale bars = 50 μm.

