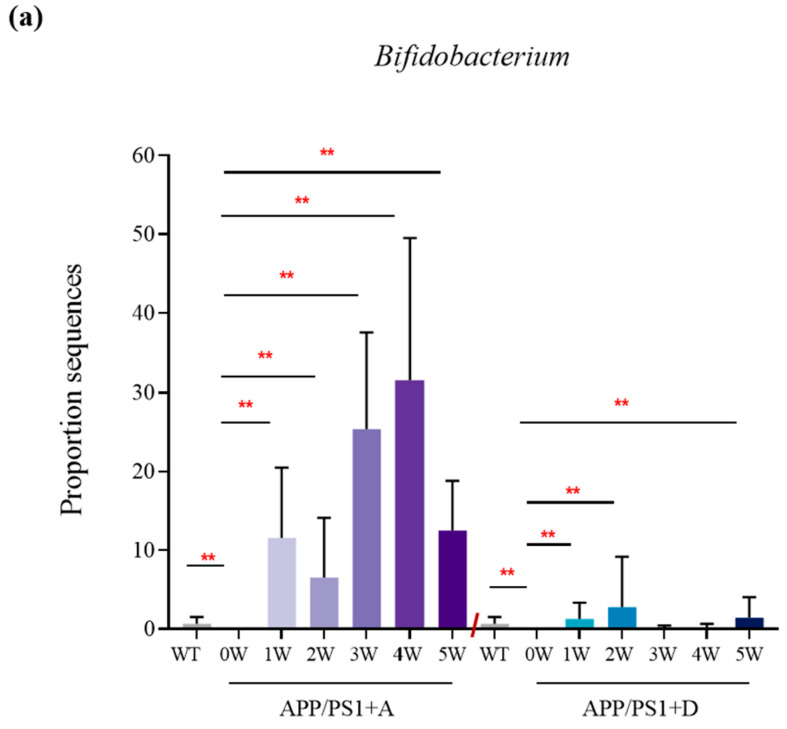
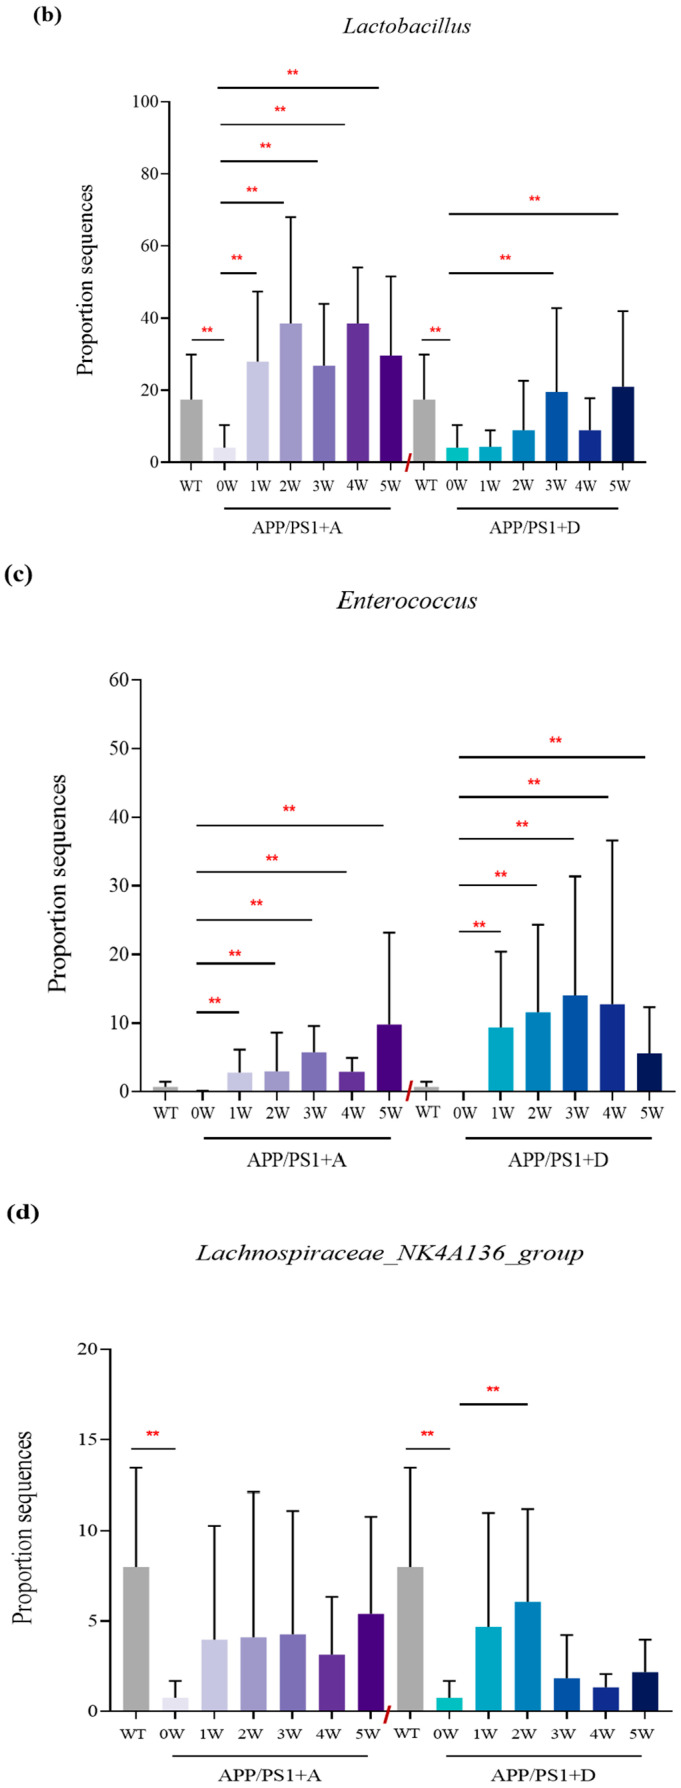
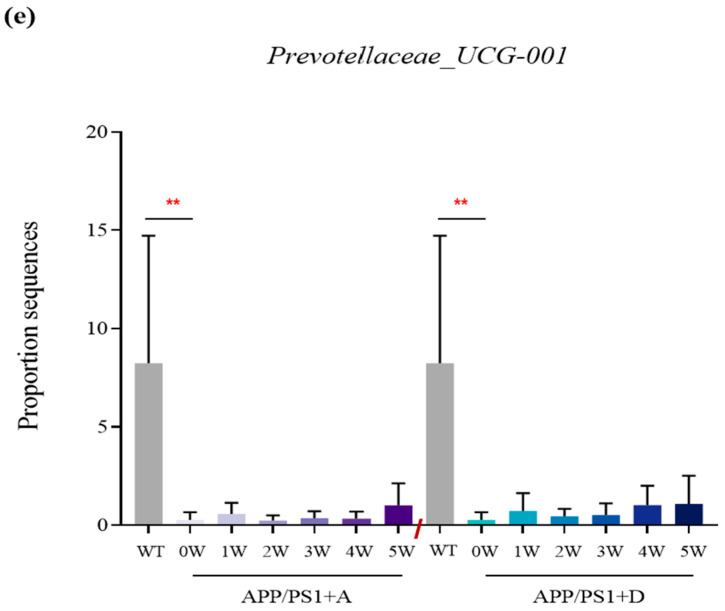
Figure 5.
Colony enrichment of APP/PS1 + A and APP/PS1 + D mice compared with that of WT (0 W) and APP/PS1 (0 W) mice at different time points (0 W, 1 W, 2 W, 3 W, 4 W, and 5 W). (a) Bifidobacterium, (b) Lactobacillus, (c) Enterococcus, (d) Lachnospiraceae_NK4A136_group, and (e) Prevotellaceae_UCG_001 Values represent the mean ± S.E.M. ** p < 0.01. n = 6 mice/group.


