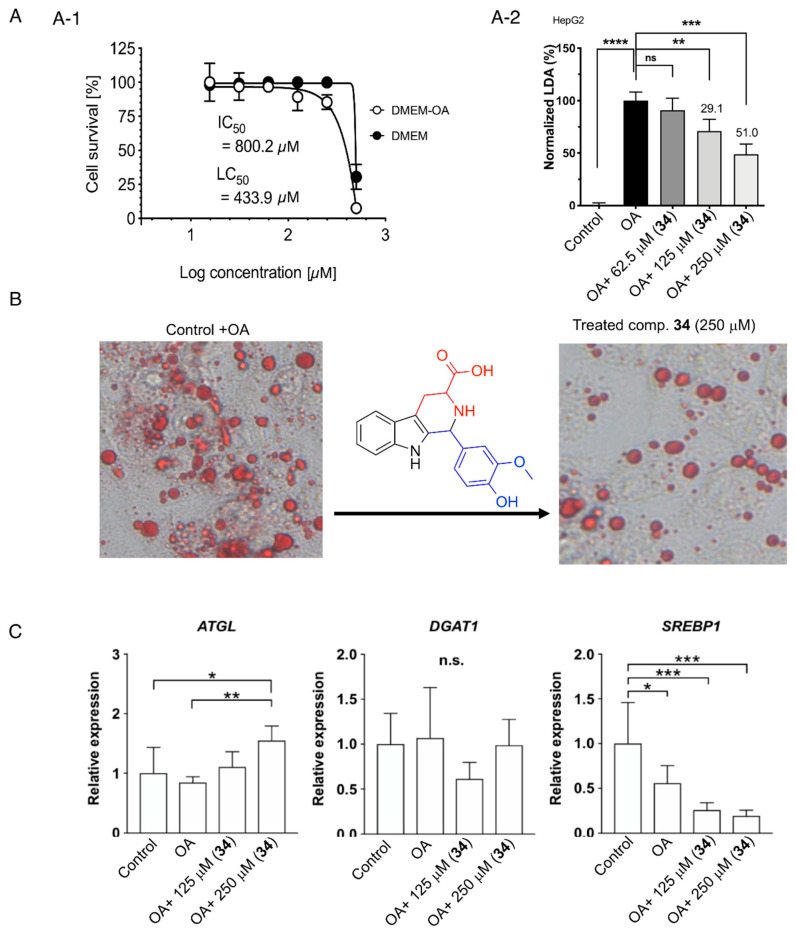
Figure 5.
(A) (A-1) Cell viability of 34 in HepG2 cells. The cytotoxicity (CC50) was expressed as the concentration at which 50% of cells died in DMEM without fatty acid (−OA). The lipocytotoxicity (LC50) was expressed as the concentration at which 50% of cells died, especially in DMEM loaded with fatty acid (+OA). (A-2) LDA inhibition (LDAI) activity of 34 in HepG2 cells. Graph showing the mean values of the LDAI (four replications). **** p < 0.0001, *** p < 0.001, ** p < 0.01 when compared with the untreated control (+OA) group. ns: not significant. (B) LDAI activity of compound 34 in HepG2 cells: phase contrast images showing LDs (red); (C) Gene expression. All data were normalized to the expression of glyceraldehyde-3-phosphate dehydrogenase (GAPDH) and were represented as the relative expression based on that of the control group. ATGL: adipose triglyceride lipase; DGAT1: diacylglycerol O-acyltransferase 1; SREBP1: sterol regulatory element-binding protein 1. ** p < 0.01, *** p < 0.001, **** p < 0.0001 (n = 6 in each group). *: statistically significant and n.s.: not significant.

