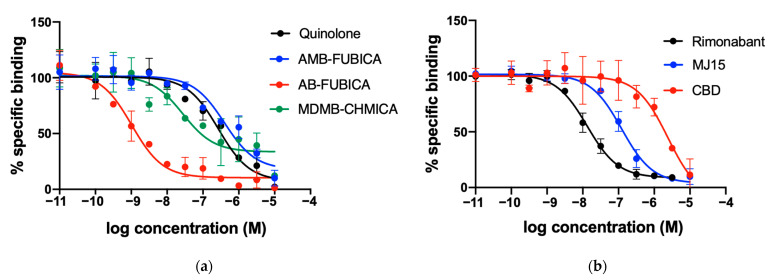
Figure 5.
Competition experiments of binding of fluorescent ligand CELT-335 to living HEK-293 T cells expressing the SNAP-CB1R. Tb labelling was performed as described in Materials and Methods. Tag-Lite® competition binding curves were obtained by using 100 nM of CELT-335 and increasing concentrations of compounds tested (0–10 μM). HTRF Ratio = 665 nm acceptor signal/620 nm donor signal × 10,000; the percentage is calculated by taking the highest value as 100%. Data represent the mean ± SEM (n = 5 in triplicates). (a) concentration/response curves obtained for agonists; (b) concentration/response curves obtained for the antagonists.

