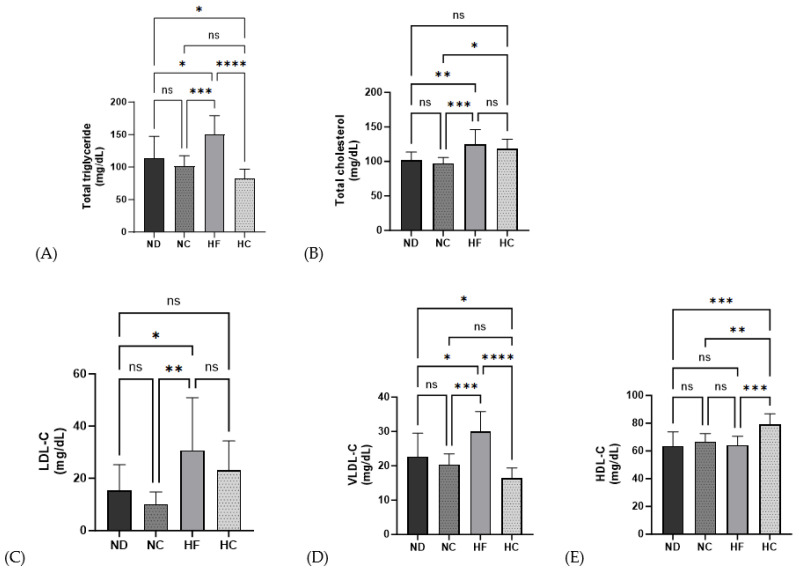
Figure 7.
Effects of cinnamon extract on the serum biochemical lipid profiles of each group: total triglyceride (A), total cholesterol (B), LDL-C (C), VLDL-C (D), and HDL-C (E). Data are expressed as means ± SD (n = 10 for each group) (**** p < 0.0001, *** p < 0.001, ** p < 0.01, * p < 0.05). ns: Not significant.

