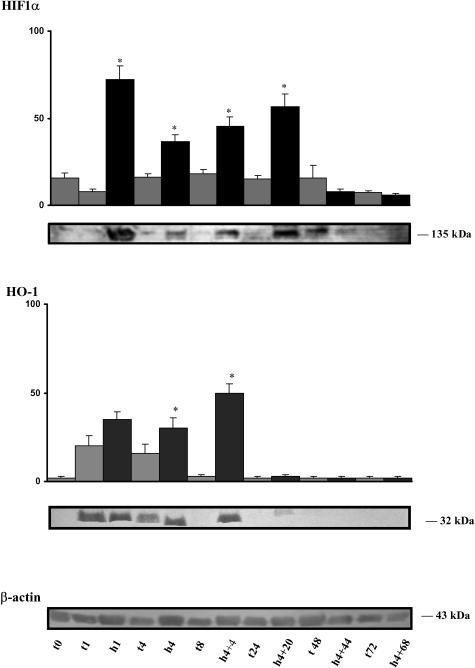
Fig 1.
Relative expression of HIF1α and heme oxygenase 1 (HO-1) in the heart after hypoxia of the piglet. Lane t0 is for the newborn control. Lanes t1, h1, t4, h4, t8, h4 + 4, t24, h4 + 20, t48, h4 + 44, t72, h4 + 68 are for control 1 hour, hypoxia 1 hour, control 4 hours, hypoxia 4 hours, control 8 hours, hypoxia 4 hours followed by 4 hours of recovery, control 24 hours, hypoxia 4 hours + 20 hours recovery, control 48 hours, hypoxia 4 hours + 44 hours recovery, control 72 hours, and hypoxia 4 hours + 68 hours recovery, respectively. Light columns are for controls and dark columns are for animals submitted to hypoxia. Hundred micrograms of protein was loaded in each lane. The last representative membrane shows the level of β-actin. Values are the mean ± standard error of mean (SEM) of separate determinations, n = 4. Asterisks indicate significant difference from the corresponding normoxic control (P < 0.001)

