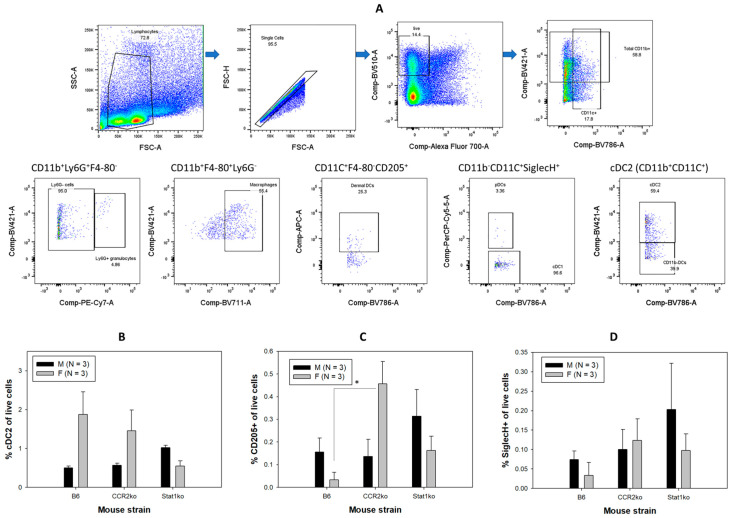
Figure 2.
Immune cell profiling using multi-color flow cytometry assay. The schematic flow chart of gating different immune cell populations from flow cytometry assays (A). Viable single leukocytes (CD45+) from either spleens or tongues were gated for subset discrimination. Total dendritic cells (CD11c+F4-80−) by exclusion of macrophage (F4-80+) cells were further analyzed to determine two dendritic cell populations including cDC1 (CD11b−CD11c+) and cDC2 (CD11b+CD11c+). Higher but not significantly higher numbers of cDC2 were found in both B6 and CCR2ko females (based on live cell population) when compared to corresponding males ((B), p > 0.05, Mann–Whitney rank sum test). Dermal DCs (CD205+) of total DCs and plasmacytoid DCs (CD11b−SiglecH+) were further determined. Macrophages (F4-80+) and granulocytes (Ly6G+) were identified within the CD11b+ cell population. Significantly higher levels of dermal DCs (F4-80−CD205+) were also found in female CCR2ko mice when compared to corresponding B6 and Stat1ko female mice as well as CCR2ko males ((C), * p < 0.05, Mann–Whitney rank sum test). No significant difference in pDCs (CD11b−SiglecH+) was found among all groups even though higher but not significantly higher numbers of pDCs were found in infected Stat1ko males ((D), p > 0.05, Mann–Whitney rank sum test).

