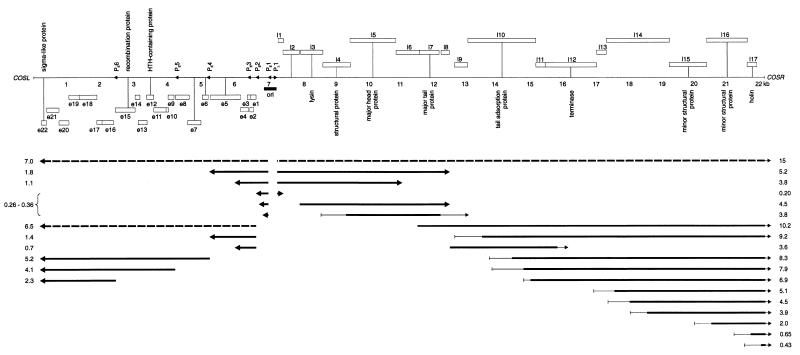
FIG. 1.
Transcript map of phage c2. The numbers directly beneath the genome indicate the distance from cosL (in kilobases). Open boxes below or above the genome indicate leftward (e1 to e22)- or rightward (l1 to l17)-reading ORFs in the early and late regions, respectively. The different box heights indicate the three different reading frames. Putative gene functions are indicated. Arrowheads indicate the leftward-directed early promoters (PE1 to PE6) and the rightward-directed late promoter (PL1). An origin of replication (ori) region is indicated by the solid bar. Solid arrows, position and direction of transcripts; broken arrows, weak transcripts not shown in Tables 1 and 2; thin lines, transcript start or end point occurs within region. Transcript sizes are indicated at the edges of the panel. The upper panel was previously published (34).

