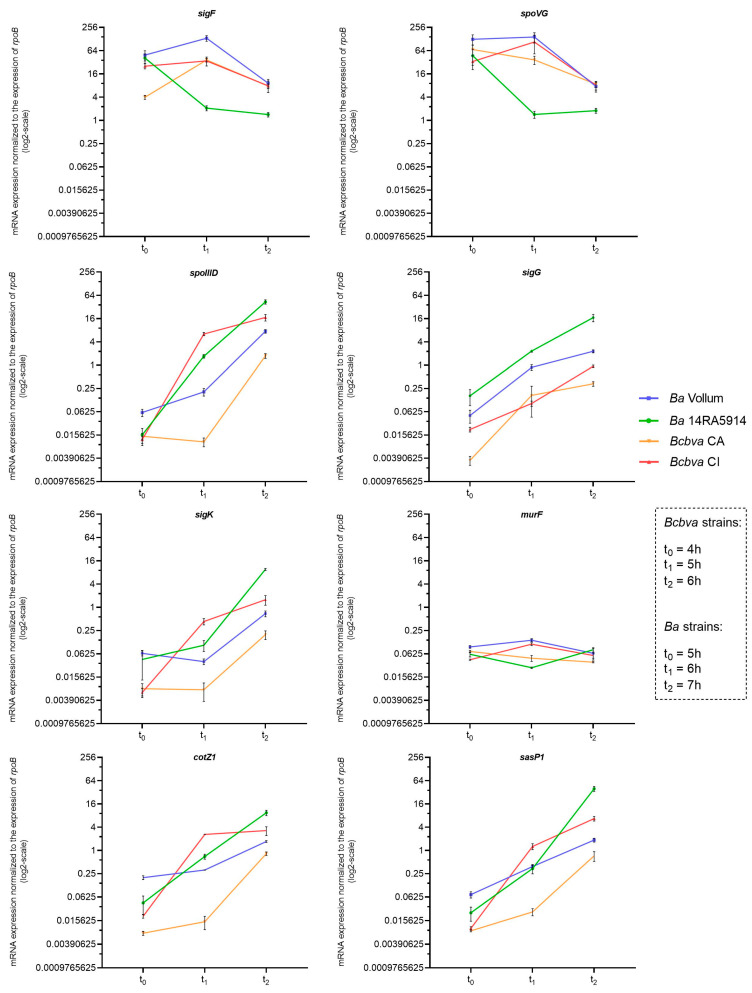
Figure 2.
Reverse transcriptase (RT) qPCR-based expression profiles of sporulation-associated genes sigF, spoVG, spoIIID, sigG, sigK, mur, cotZ1 and sasP in Ba and Bcbva strains. For each gene, levels of mRNA transcripts were determined by RNA sampling at time points t0, t1 and t2, corresponding to 5, 6, and 7 h of growth for Ba strains and 4, 5, and 6 h of growth for Bcbva strains. For each target gene, relative transcript expression levels were determined by normalization to the control gene rpoB. The mean and standard error values from three independent experiments are shown.

