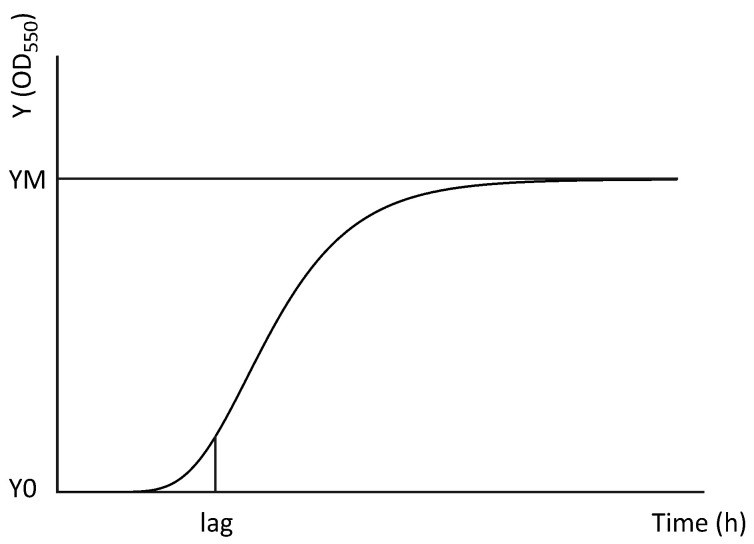
Figure 1.
Visual representation of the modified Gompertz growth function (Y = Y0 + (YM − Y0) * exp(−exp(K * (lag − X)/(YM − Y0) + 1)). Y0 and YM represent the starting population and maximum population (upper asymptote), respectively, and are both expressed as values of optical density (OD550). Lag (expressed in h) represents the time point when the exponential bacterial growth actually begins.

