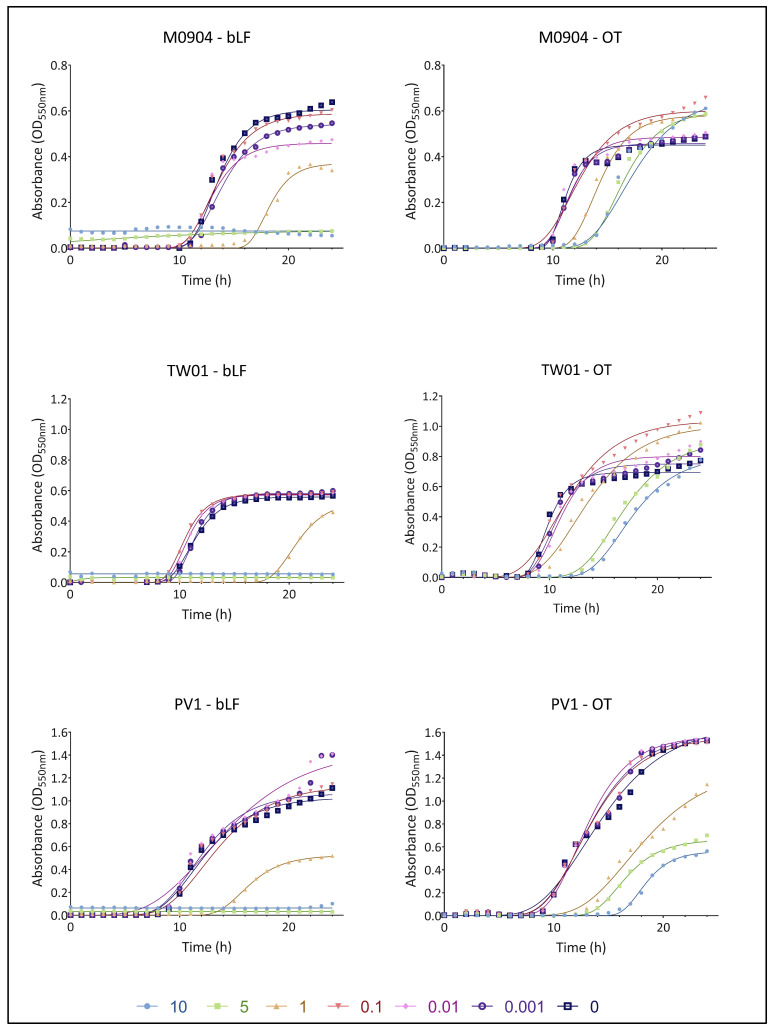
Figure 3.
Growth curves of Vp M0904, Vp TW01 and Vp PV1, with a starting concentration of 101 CFU/mL, and incubation with bLF and OT at concentrations 0, 0.001, 0.01 0.1, 1, 5 and 10 mg/mL. Individual points represent the mean OD550 (n = 3); curves are the non-linear fitting to the modified Gompertz model.

