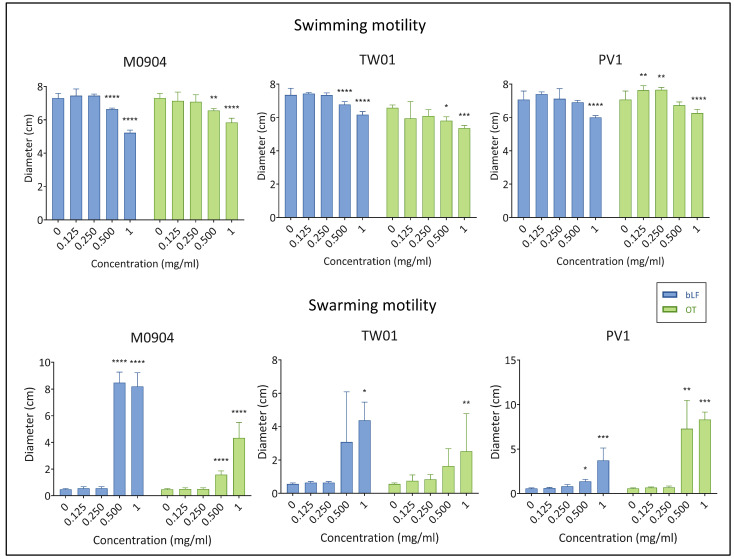
Figure 6.
Effect of bLF and OT on swimming and swarming motility. Mean diameters of the swimming or swarming colonies and 95% confidence interval are shown on the graphs. Significant differences between transferrin treatment and relative control (0 mg/mL) are indicated by asterisks: * p < 0.05, ** p < 0.01, *** p < 0.001, **** p < 0.0001.

