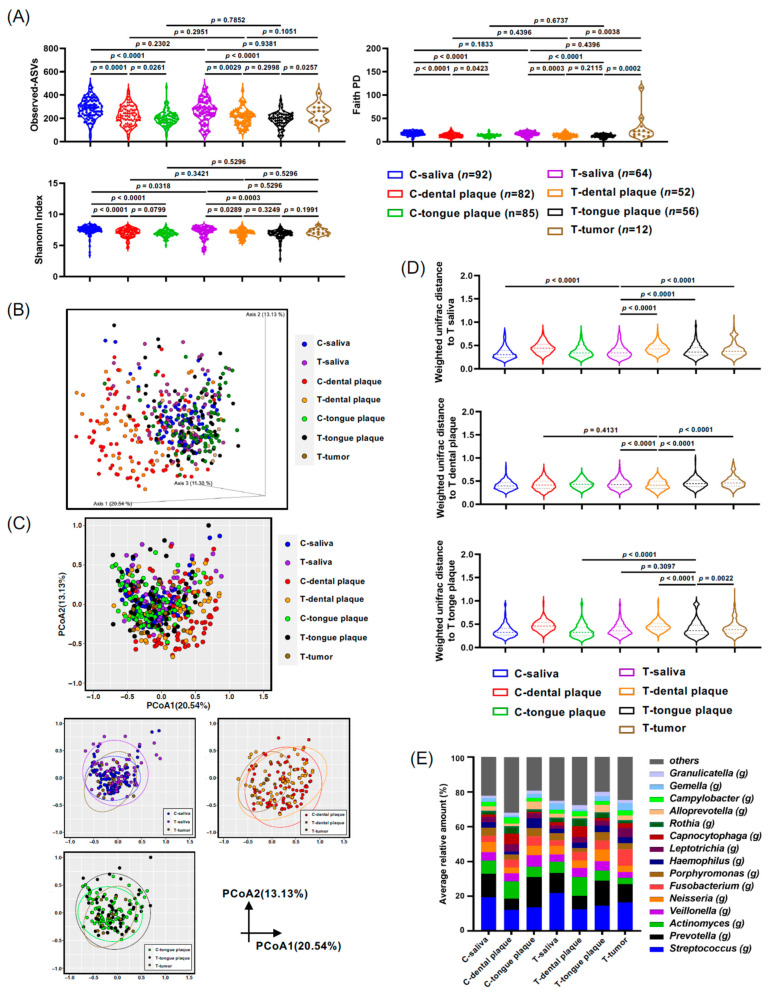
Figure 1.
Microbiota from the saliva, dental plaque, tongue plaque, and tumor tissue of the oral cancer (T-) and control groups (C-). (A) Violin plots depicting the alpha diversity using the Shannon index and Faith PD. (B,C) Weighted UniFrac principal coordinates analysis (PCoA) of oral microbiota compared between the oral cancer and control groups (3D plot (B) and 2D plot (C)). (D) Violin plots displaying the Weighted UniFrac distances to saliva (T-saliva), dental plaque (T-dental plaque), and tongue plaque (T-tongue plaque) in oral cancer. (E) Oral microbiota composition determined through 16S rRNA gene sequencing. The genus-level taxonomic distribution of individual microbes is displayed. Data in (A,D) were compared between the two indicated groups using a pairwise Wilcoxon rank-sum test with a Benjamini–Hochberg adjustment.

