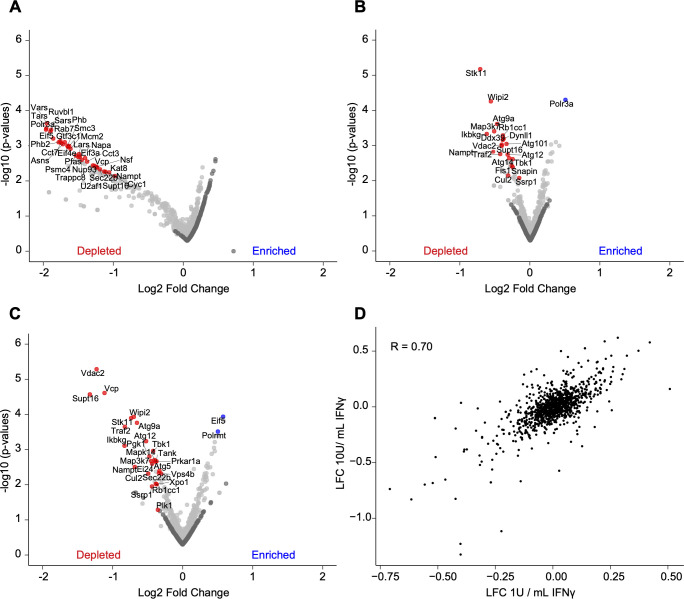
Fig 2.
Identification of genes required for viability in passage or IFNγ-treated BV-2 cells. (A) Volcano plot of mock treatment guides enriched or depleted relative to 5 days post-puromycin selection. (B) Volcano plot of guides enriched or depleted after 1 U/mL IFNγ treatment relative to mock treatment. (C) As in (B) for 10 U/mL IFNγ treatment. (D) Average log2 fold change (LFC) of 1 U/mL IFNγ condition versus LFC of 10 U/mL IFNγ condition. Pearson correlations are indicated. For volcano plots, the LFC of all sgRNAs for each gene is plotted against the −log10(P value) for each gene. Blue and red highlighted genes in (A–C) represent a STARS score with FDR < 0.01 and dark gray genes represent non-targeting guides.

