
Fig 3.
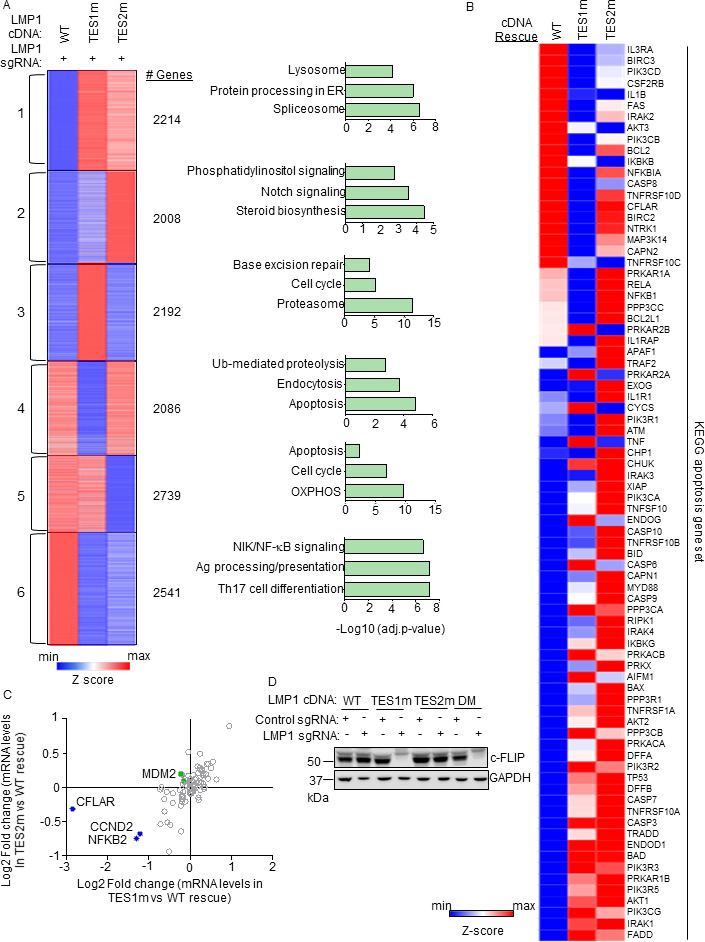
Characterization of host genome-wide TES1 vs TES2 LCL target genes. (A) RNAseq K-means heatmap analysis of GM12878 LCLs transduced with lentivirus expressing LMP1 sgRNA and induced for WT, TES1m, or TES2m rescue cDNA expression for 6 days. The heatmap depicts relative Z-scores in each row from n = 3 independent RNAseq data sets, divided into six clusters. The Z-score scale is shown at bottom, where blue and red colors indicate lower vs higher relative expression, respectively. Two-way ANOVA P-value cutoff of <0.05 and >2-fold gene expression cutoffs were used. The top three most highly enriched KEGG pathways amongst genes within each cluster are shown at right. (B) Heatmap analysis of KEGG apoptosis pathway gene relative row Z-scores from RNAseq analysis as in panel A. The Z-score scale is shown at bottom, where blue and red colors indicate lower vs higher relative expression, respectively. Two-way ANOVA P-value cutoff of <0.05 and >2-fold gene expression cutoffs were used. (C) Scatter plot analysis cross comparing log2 transformed fold change of LCL dependency factor mRNA abundances in GM12878 expressing LMP1 sgRNA together with TES2 mutant vs wild-type cDNA rescue (y-axis) and TES1 mutant vs wild-type cDNA rescue (x-axis) from triplicate RNAseq data sets, as in panel A. This analysis highlighted that CFLAR and to a lesser extent NFKB2 and CCND2 mRNAs were more highly downmodulated by TES1m than TES2m rescue, relative to levels in cells with WT LMP1 rescue. Shown are genes differentially regulated by >2-fold with either TES1m or TES2m rescue, relative to levels with WT LMP1 rescue. (D) Immunoblot analysis of c-FLIP and load control GAPDH expression in WCL from GM12878 LCLs with the indicated control or LMP1 sgRNA and LMP1 rescue cDNA expression. Representative of n = 3 experiments.