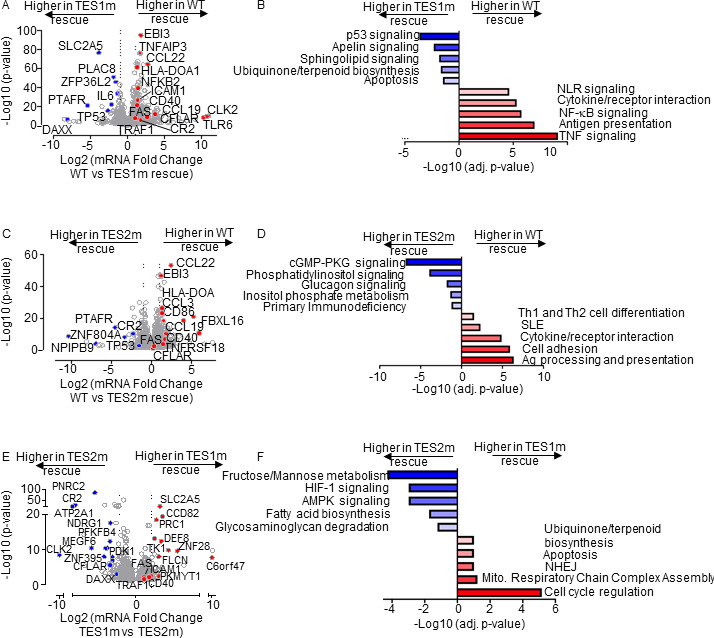
Fig 4.

Characterization of LCL pathways targeted by TES1 vs TES2 signaling. (A) Volcano plot analysis of host transcriptome-wide GM12878 genes differentially expressed in LMP1 KO GM12878 with WT vs TES1 mutant cDNA rescue. Higher x-axis fold changes indicate higher expression with WT LMP1 rescue, whereas lower x-axis fold changes indicate higher expression with TES1m rescue. Data are from n = 3 RNAseq data sets, as in Fig. 3. (B) Enrichr analysis of KEGG pathways most highly enriched in RNAseq data as in panel A among genes more highly expressed in LMP1 KO GM12878 with WT than TES1m rescue (red) vs among genes more highly expressed with TES1m than WT rescue (blue). (C) Volcano plot analysis of host transcriptome-wide GM12878 genes differentially expressed in LMP1 KO GM12878 with WT vs TES2 mutant cDNA rescue. Higher x-axis fold changes indicate higher expression with WT LMP1 rescue, whereas lower x-axis fold changes indicate higher expression with TES2m rescue. Data are from n = 3 RNAseq data sets, as in Fig. 3. (D) Enrichr analysis of KEGG pathways most highly enriched in RNAseq data as in panel C among genes more highly expressed in LMP1 KO GM12878 with WT than TES2m rescue (red) vs among genes more highly expressed with TES2m than WT rescue (blue). (E) Volcano plot analysis of host transcriptome-wide GM12878 genes differentially expressed in LMP1 KO GM12878 with TES1 vs TES2 mutant cDNA rescue. Higher x-axis fold changes indicate higher expression with TES1m rescue, whereas lower x-axis fold changes indicate higher expression with TES2m rescue. Data are from n = 3 RNAseq data sets, as in Fig. 3. (F) Enrichr analysis of KEGG pathways most highly enriched in RNAseq data as in panel E amongst genes more highly expressed in LMP1 KO GM12878 with TES1m than TES2m rescue (red) vs among genes more highly expressed with TES2m than TES1m rescue (blue).
