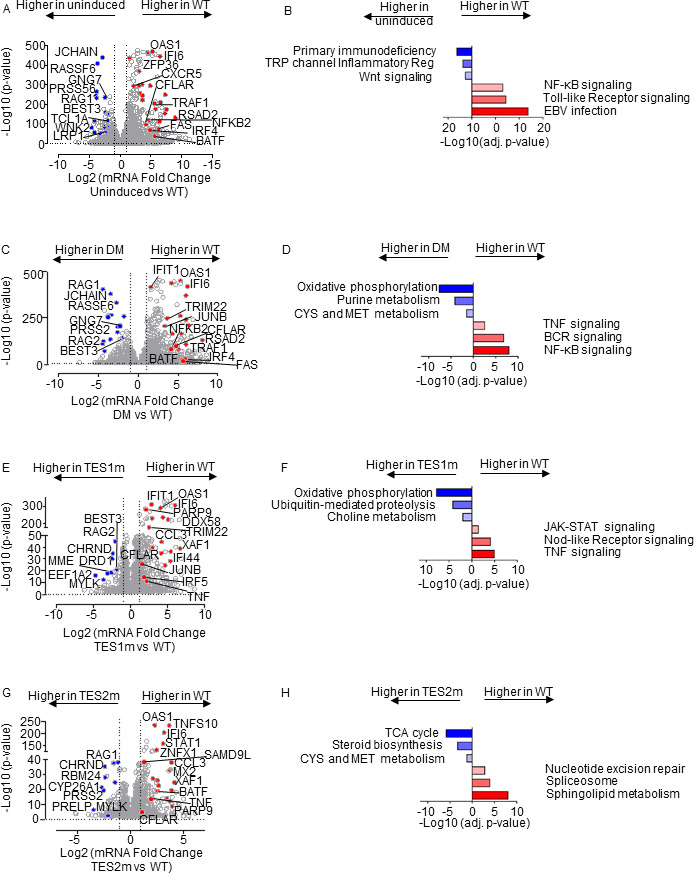
Fig 6.

Characterization of Akata B-cell pathways targeted by TES1 vs TES2 signaling. (A) Volcano plot analysis of host transcriptome-wide genes differentially expressed in Akata cells conditionally induced for WT LMP1 for 24 h by 250 ng/mL Dox vs in mock-induced cells. Higher x-axis fold changes indicate genes more highly expressed in cells with WT LMP1 expression, whereas lower x-axis fold changes indicate higher expression in cells mock induced for LMP1. Data are from n = 3 RNAseq data sets, as in Fig. 5. (B) Enrichr analysis of KEGG pathways most highly enriched in RNAseq data as in panel A among genes more highly expressed in Akata with WT LMP1 (red) vs among genes more highly expressed with mock LMP1 induction (blue). (C) Volcano plot analysis of host transcriptome-wide genes differentially expressed in Akata cells conditionally induced for WT vs DM LMP1 expression for 24 h by 250 ng/mL Dox. Higher x-axis fold changes indicate genes more highly expressed in cells with WT LMP1 expression, whereas lower x-axis fold changes indicate higher expression in cells with DM LMP1. Data are from n = 3 RNAseq data sets, as in Fig. 5. (D) Enrichr analysis of KEGG pathways most highly enriched in RNAseq data as in panel C among genes more highly expressed in Akata with WT LMP1 (red) vs among genes more highly expressed with DM LMP1 (blue). (E) Volcano plot analysis of host transcriptome-wide genes differentially expressed in Akata cells conditionally induced for WT vs TES1m LMP1 for 24 h by 250 ng/mL Dox. Higher x-axis fold changes indicate genes more highly expressed in cells with WT LMP1, whereas lower x-axis fold changes indicate higher expression in cells with TES1m LMP1. Data are from n = 3 RNAseq data sets, as in Fig. 5. (F) Enrichr analysis of KEGG pathways most highly enriched in RNAseq data as in panel E among genes more highly expressed in Akata with WT LMP1 (red) vs among genes more highly expressed with TES1m LMP1 induction (blue). (G) Volcano plot analysis of host transcriptome-wide genes differentially expressed in Akata cells conditionally induced for WT vs TES2m LMP1 for 24 h by 250 ng/mL Dox. Higher x-axis fold changes indicate genes more highly expressed in cells with WT LMP1 expression, whereas lower x-axis fold changes indicate higher expression in cells with TES2m LMP1. Data are from n = 3 RNAseq data sets, as in Fig. 5. (H) Enrichr analysis of KEGG pathways most highly enriched in RNAseq data as in panel G among genes more highly expressed in Akata with WT LMP1 (red) vs among genes more highly expressed with TES2m LMP1 induction (blue).
