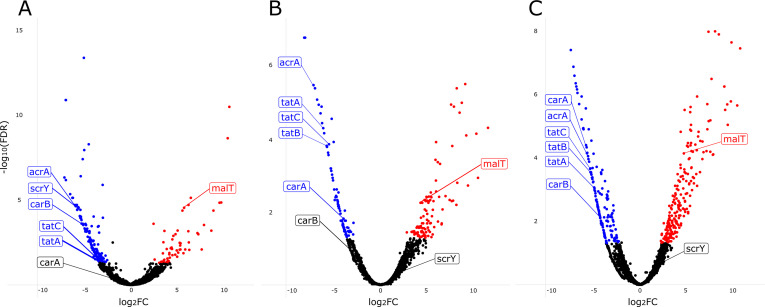
Fig 4.
Volcano plots showing results of transposon insertion sequencing experiments in mice. Genes in which insertions were associated with decreased GI colonization (blue dots) and increased colonization (red dots) for (A) CRE-166, (B) KPN46, and (C) Z4160 are shown. Labeled points indicate targets that were chosen for the creation of isogenic mutants. FDR, false discovery rate; FC, fold change.

