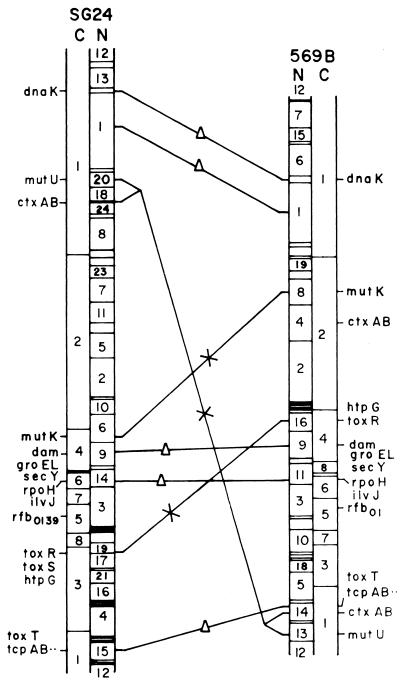
FIG. 6.
Comparison of the chromosome maps of V. cholerae O139 strain SG24 and V. cholerae classical O1 strain 569B. For a better comparison, the circular maps were linearized. A triangle on a line connecting the two genomes indicates a conserved region, and regions in the chromosomes that have undergone rearrangement are indicated by an X on a connecting line. C and N represent CeuI and NotI maps, respectively.

