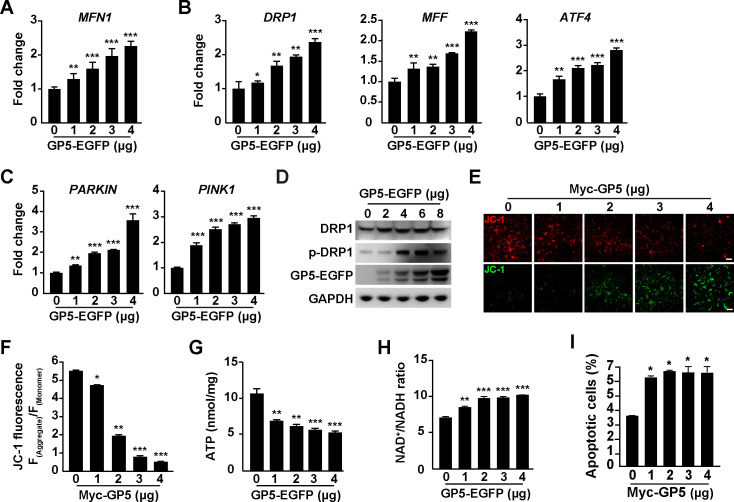
Fig 3.
PRRSV GP5 alters mitochondrial dynamics. (A) MARC-145 cells were transfected with GP5-EGFP (0–4 µg) for 24 h. The mRNA levels of MFN1 were analyzed by qRT-PCR analysis. **P < 0.01, ***P < 0.001. (B) MARC-145 cells were transfected with GP5-EGFP (0–4 µg) for 24 h. The mRNA levels of DRP1, MFF, and ATF4 were analyzed by qRT-PCR analysis. *P < 0.05, **P < 0.01, ***P < 0.001. (C) MARC-145 cells were transfected with GP5-EGFP (0–4 µg) for 24 h. The mRNA levels of PARKIN and PINK1 were analyzed by qRT-PCR analysis. **P < 0.01, ***P < 0.001. (D) MARC-145 cells were transfected with GP5-EGFP (0–8 µg) for 24 h. DRP1, p-DRP1, Tom20, and GP5-EGFP were analyzed by immunoblotting analysis. (E) MARC-145 cells were transfected with Myc-GP5 (0–4 µg) for 24 h. The mitochondrial membrane potential was analyzed by JC-1 staining. Scale bar: 10 µm. (F) Quantification of the ratio of aggregated and monomer JC-1 from (E). *P < 0.05, **P < 0.01, ***P < 0.001. (G) Cellular ATP was measured in MARC-145 cells transfected with GP5-EGFP (0–4 µg) for 24 h. **P < 0.01, ***P < 0.001. (H) NAD+/NADH ratio was measured in MARC-145 cells transfected with GP5-EGFP (0–4 µg) for 24 h. **P < 0.01, ***P < 0.001. (I) MARC-145 cells were transfected with Myc-GP5 (0–4 µg) for 48 h. Apoptosis assay was performed by Annexin V FITC and PI staining. *P < 0.05.

