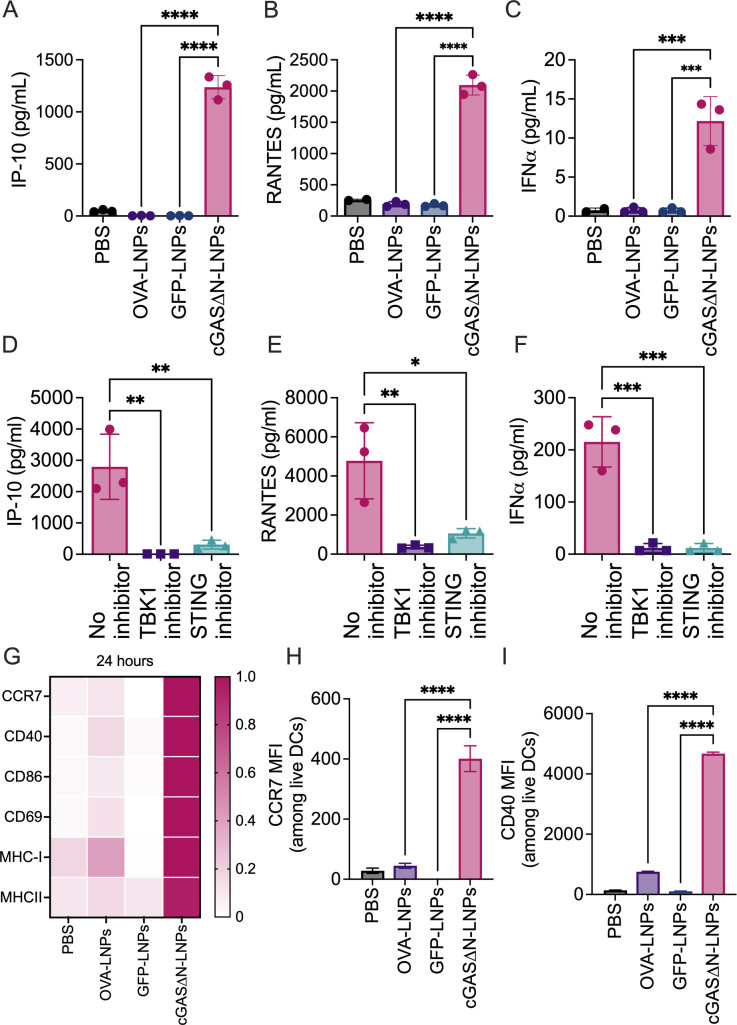
Fig 3.
cGAS∆N-LNPs induce type I IFN response and DC activation. (A–C) FLT3L-DCs treated with PBS, OVA-LNPs, GFP-LNPs, or cGAS∆N-LNPs. The levels of (A) IP-10, (B) RANTES, and (C) IFNα in the culture supernatant were measured by multiplex bead array. The mean values and SD of three biological triplicates are shown. (D–F) FLT3L-DCs were treated with cGAS∆N-LNPs alone or cGAS∆N-LNPs in the presence of a TBK1 inhibitor or STING inhibitor. The levels of (D) IP-10, (E) RANTES, and (F) IFNα in the culture supernatant were measured in triplicates, and the mean values are shown. (G and H) FLT3L-DC treated with indicated conditions. The expression of DC activation markers, CCR7, CD40, CD86, CD69, MHC-I, and MHC-II by flow cytometry (G–I). The normalized MFI values of each marker are represented as a single color gradient heat map. The MFI and SEM of CCR7 (H) and CD40 (I) from triplicates are shown. In all the plots, individual data points represent the values of individual treatments of the triplicate. Data are representative of at least two experiments. Comparisons between groups were completed using a one-way ANOVA with a Tukey post hoc test for multiple comparisons. *P < 0.05, **P < 0.01, ***P < 0.005, and ****P < 0.0001.

