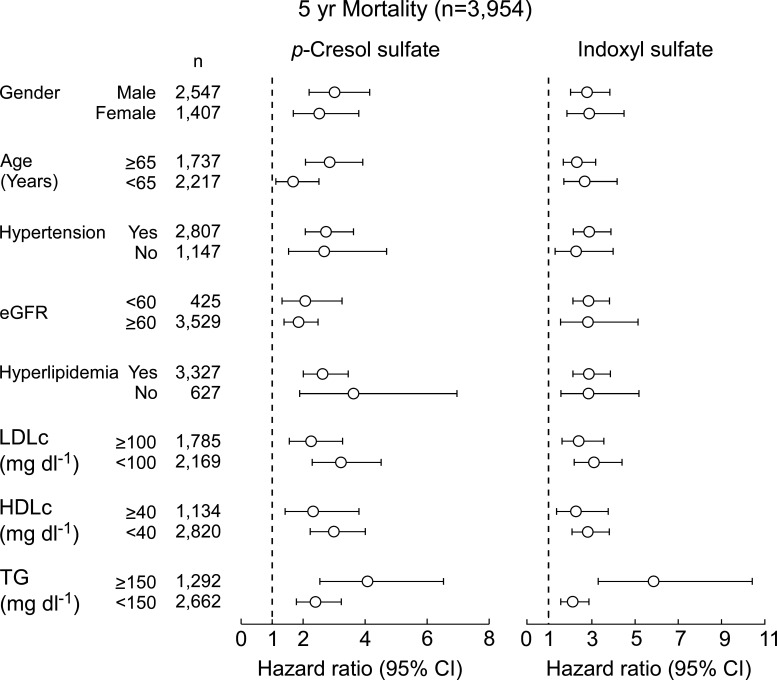
Fig 3.
Long-term mortality risk among patient subgroups. Hazard ratio for 5-year overall mortality based on the Cox proportional hazards regression analysis comparing fourth vs first (referent) quartiles (Q). Data points (open circles) in the center indicate HR and 95% CIs are represented by line length. Numbers for each subgroup are indicated by n. eGFR, estimated glomerular filtration rate; LDL-c, low-density lipoprotein cholesterol; HDL-c, high-density lipoprotein cholesterol; TG, triglyceride.

