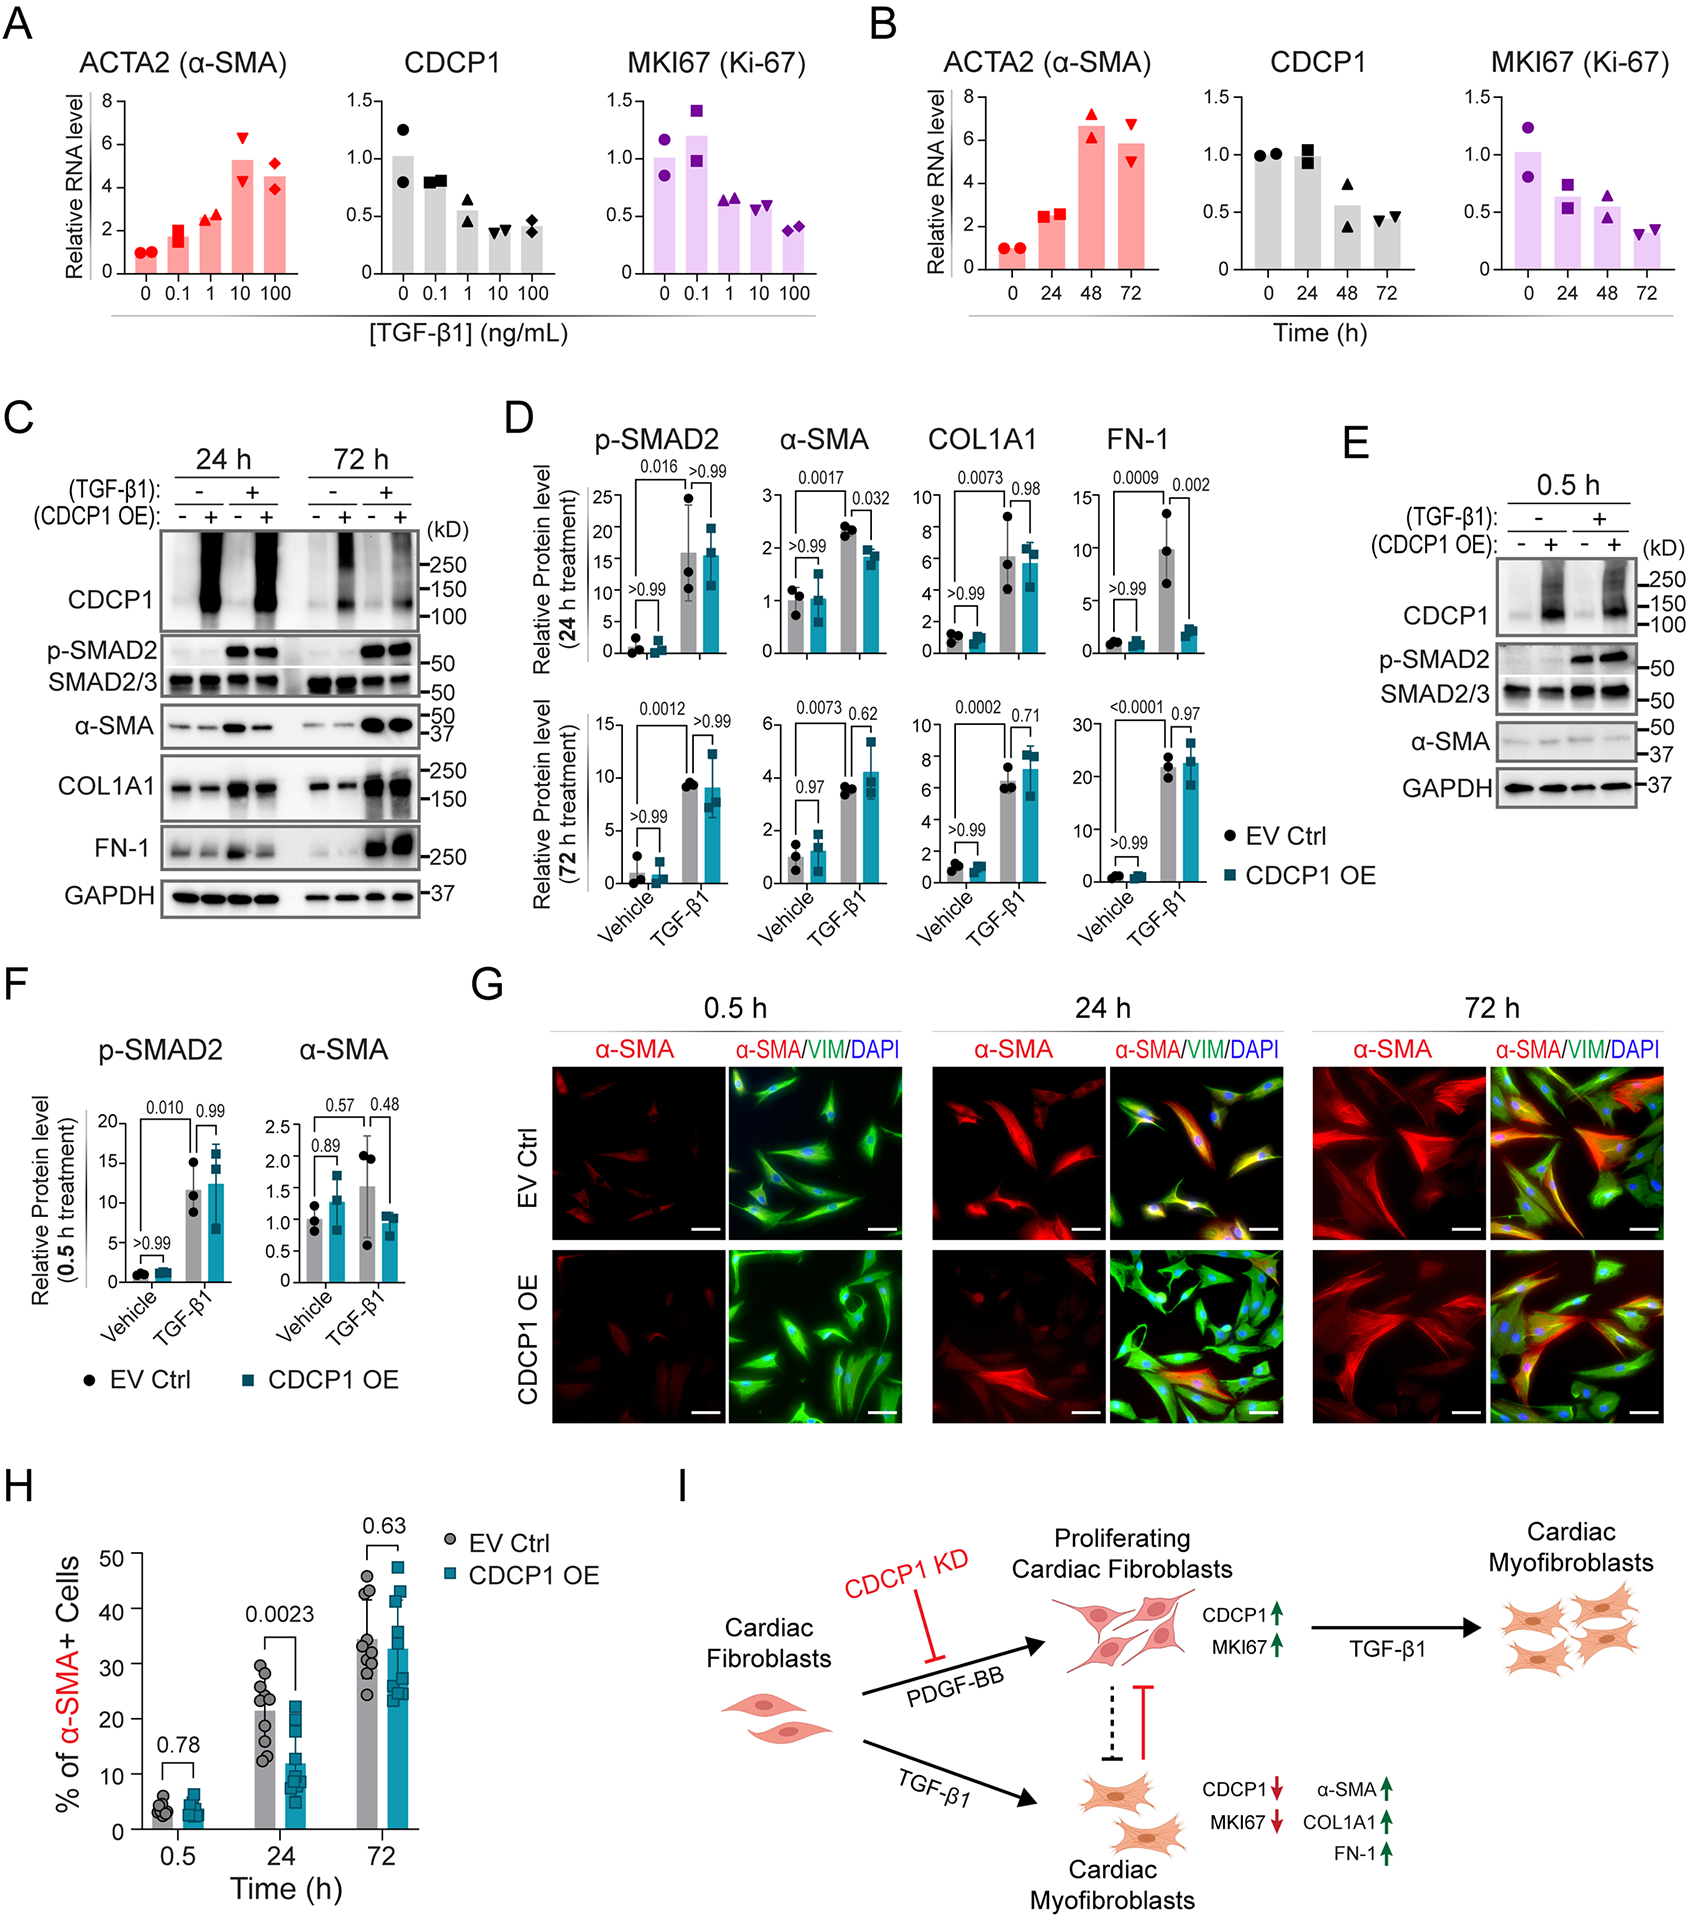
Figure 5. CDCP1 and TGF-β1-induced cardiac fibroblast-to-myofibroblast transdifferentiation.

(A) Relative mRNA levels of ACTA2, CDCP1 and MKI67 in HCFs after 48-hour treatment of TGF-β1 at different concentrations, and (B) after 10 ng/mL of TGF-β1 treatment at different time (hours). RNA levels were quantified by RT-qPCR with GAPDH level as internal control from duplicate assays. (C) Western blot for CDCP1 and other protein markers in HCFs with or without CDCP1 overexpression (OE), and with or without TGF-β1 treatment (10 ng/mL) at two time points (24 and 72 hours of treatment). Phosphorylated SMAD2 (p-SMAD2) and α-SMA were blotted for control of TGF-β1 treatment and myofibroblast transdifferentiation, respectively. Extracellular matrix (ECM) proteins including collagen type I alpha 1 chain (COL1A1), and fibronectin 1 (FN-1) were also blotted. GAPDH were blotted as internal control. (D) Relative protein level quantified from three independent samples by Western blot assays as represented in (C). Protein levels were normalized to GAPDH level and then to vehicle and empty vector control (EV Ctrl) sample. Error bars represent standard deviations of triplicate assays. P-values were calculated by ordinary one-way ANOVA with Tukey’s multiple comparisons test. (E) Western blot for CDCP1, p-SMAD2 and α-SMA in HCFs with or without CDCP1 overexpression (OE), and with or without half hour of TGF-β1 treatment (10 ng/mL). (F) Relative protein level quantified from three independent samples by Western blot assays as represented in (E). Protein levels were normalized to GAPDH level and then to vehicle and empty vector control (EV Ctrl) sample. Error bars represent standard deviations of triplicate assays. P-values were calculated by ordinary one-way ANOVA with Tukey’s multiple comparisons test. (G) Immunofluorescent (IF) staining of α-SMA and vimentin (VIM) in HCFs transfected with empty vector (EV Ctrl) and CDCP1 cDNA plasmid (CDCP1 OE) and TGF-β1 treatment (10 ng/mL) at 0.5, 24 and 72 hours. Scale bars represent 100 μm. (H) Percentage of α-SMA positive (α-SMA+) cells based on the IF staining as represented in (G). Total cell number was counted by DAPI staining. For each condition, α-SMA+ cells were counted from 10 different fields in triplicate independent wells. P-values were calculated by multiple unpaired t tests. (I) CDCP1 function in cardiac fibroblasts. PDGF-BB stimulates cardiac fibroblasts proliferation, as well as upregulation of the Maker of Proliferation Ki-67 (MKI67). Expression of CDCP1, was upregulated in PDGF-BB-stimulated proliferating cardiac fibroblasts. TGF-β1 stimulates cardiac fibroblasts-to-myofibroblasts transdifferentiation which, meanwhile, stops cardiac fibroblasts proliferation, as indicated by downregulation of MKI67 and upregulation of α-SMA (also known as Cell Growth-Inhibiting Gene 46 Protein) in cardiac myofibroblasts. Extracellular matrix genes, including COL1A1 and FN-1, were up-regulated in myofibroblasts. CDCP1 knock-down (KD) inhibits cardiac fibroblasts cell proliferation which could lead to less transdifferentiated myofibroblasts.
