
Figure 6. Transcriptome profiling of CDCP1 knock-down (KD) in HCFs.
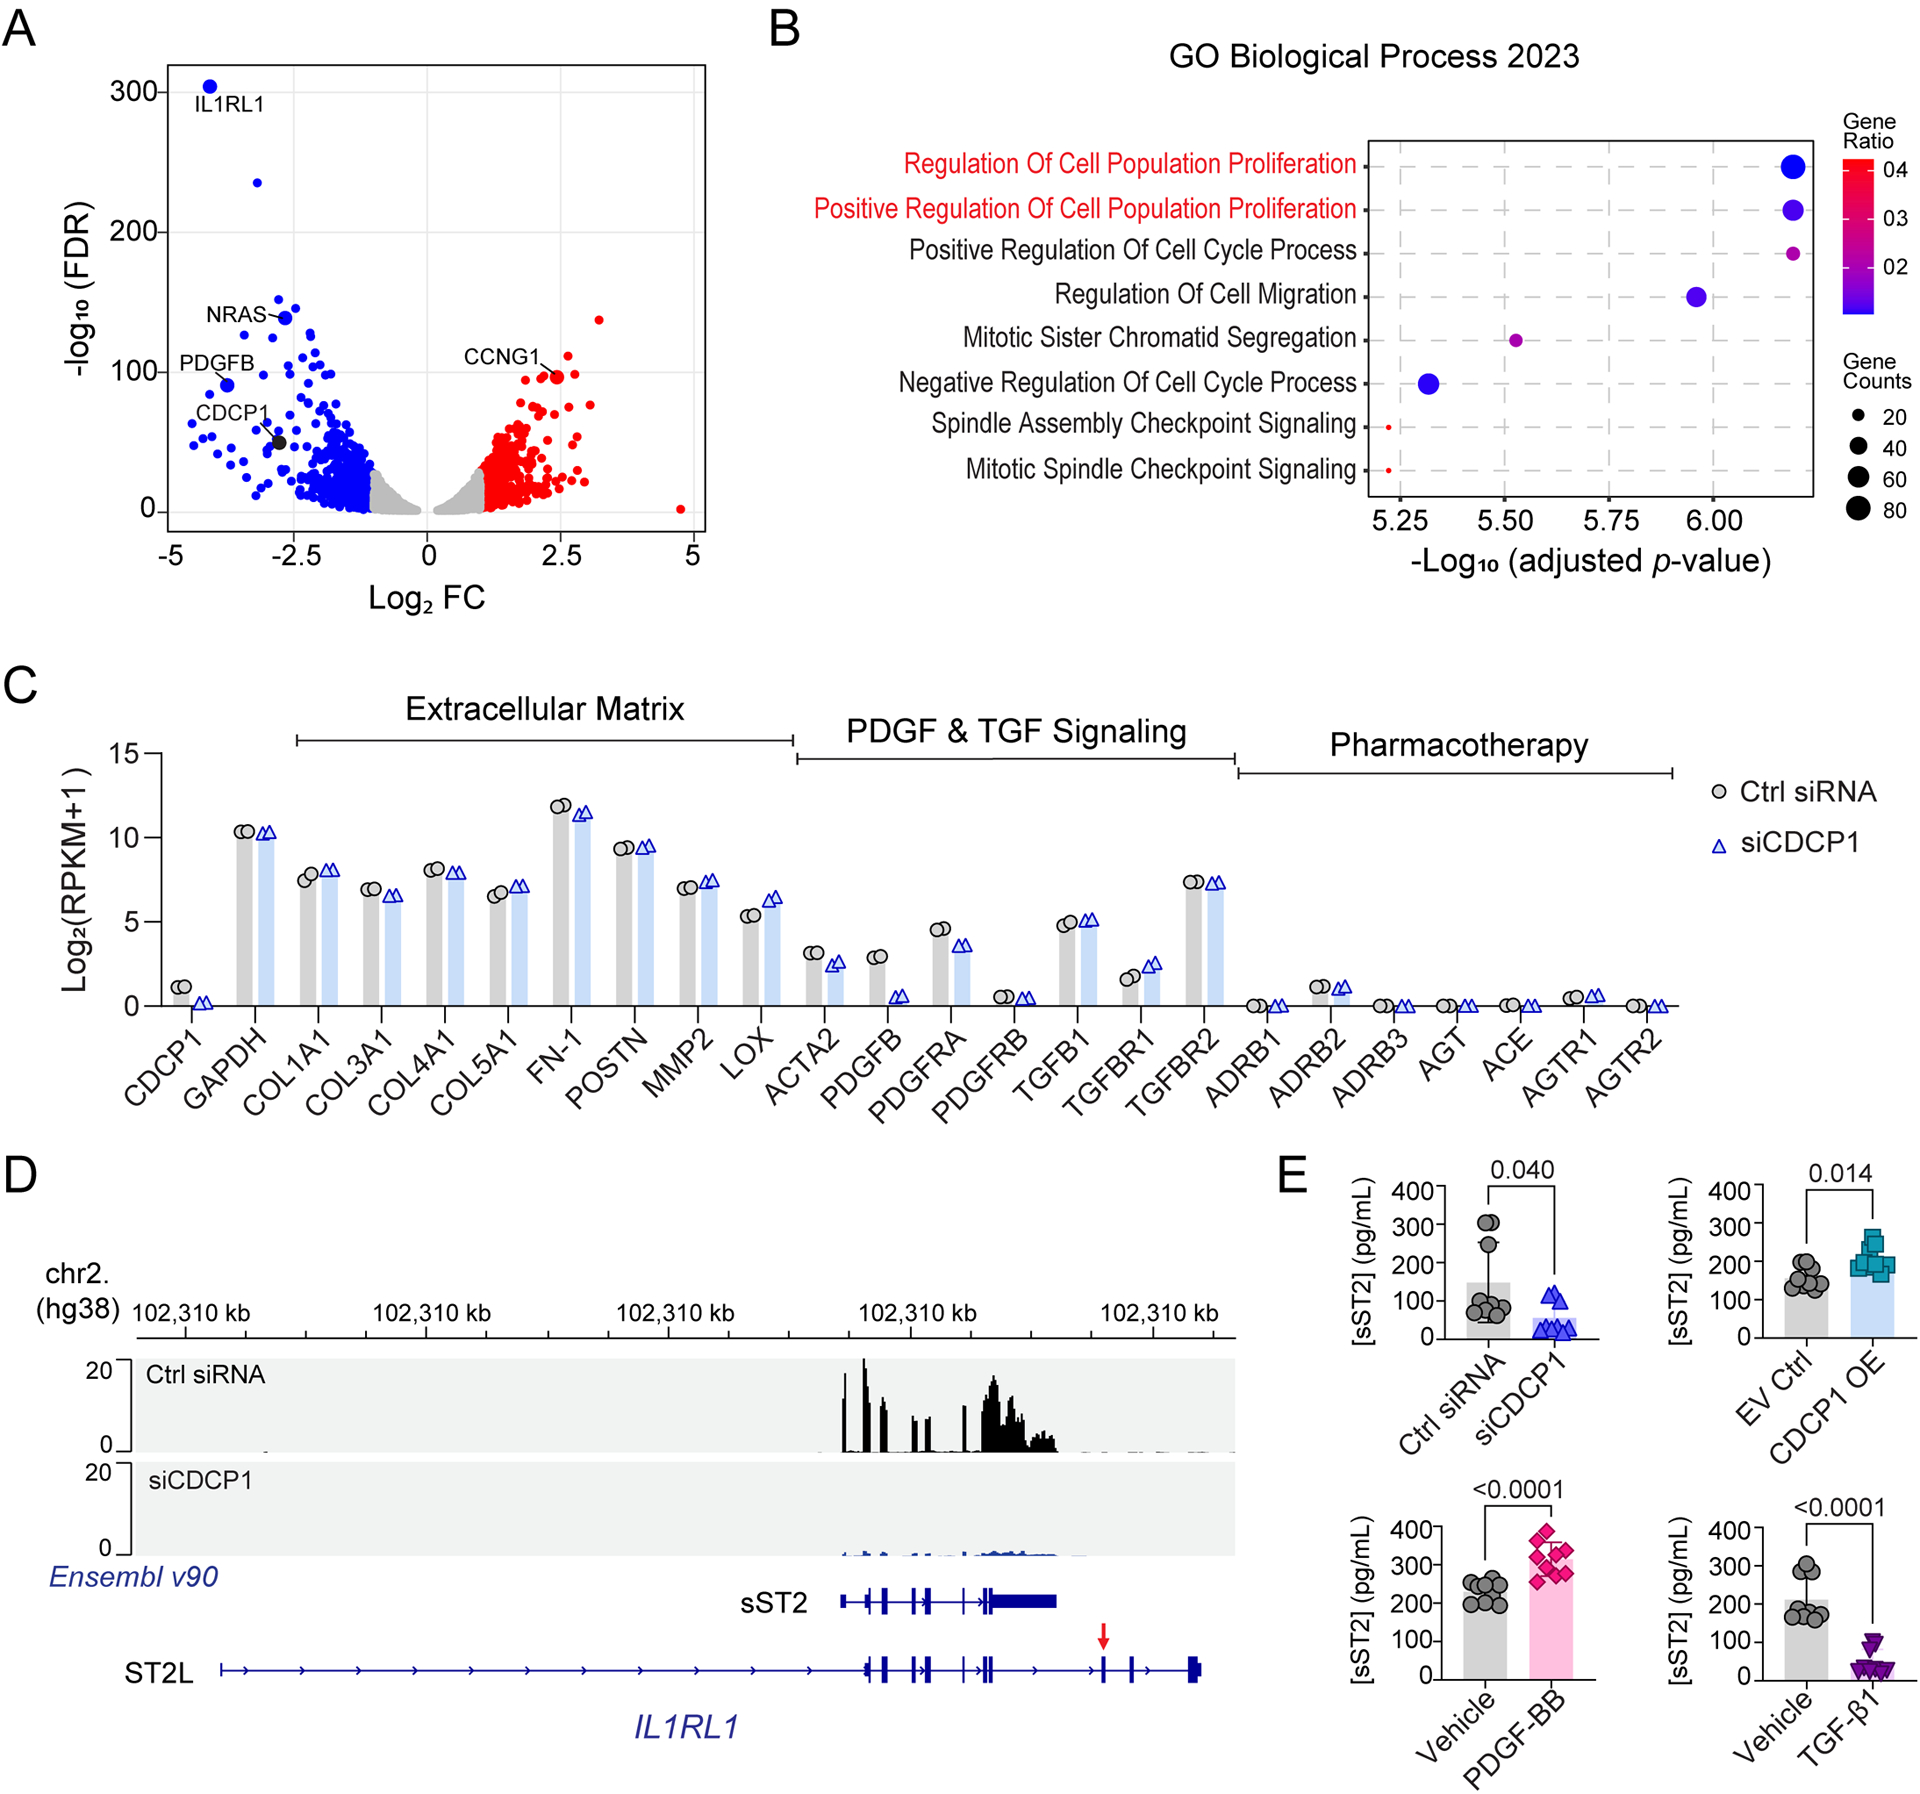
(A) Volcano plot for RNA-seq identified differentially expressed genes (DEGs) in HCFs after CDCP1 KD. The X-axis is log2 fold change (FC) in RNA level when comparing the HCFs transfected with CDCP1 siRNAs (siCDCP1) to the non-target control siRNAs (Ctrl siRNA). The Y-axis is −log10 false discovery rate (FDR) calculated from duplicates. Two biological replicate RNA samples from each experiment groups were sequenced. Each dot represents a gene quantified by the RNA-seq. (B) Top pathways enriched by DEGs after CDCP1 KD (FC > 2.0; FDR < 0.05) in the Gene Ontology (GO) enrichment analysis of Biological Process. The p-value for pathway enrichment was computed from the Fisher exact test and adjusted by using the Benjamini-Hochberg method for correction for multiple hypotheses testing. (C) Gene expression level in HCFs quantified by RNA-seq. RNA level of CDCP1, GAPDH, and genes function in extracellular matrix, PDGF and TGF signaling, and genes involved in the mechanism of actions of standard DCM pharmacotherapy were plotted. RPKM = Reads Per Kilobase of transcript, per Million mapped reads. (D) RNA-seq reads mapping to the IL1RL1 gene in HCFs. Panels (from top to bottom) are physical position of the IL1RL1 gene on chromosome 2 based on the human genome assembly hg38; RNA-seq reads mapped to the IL1RL1 gene in HCFs transfected with non-targeting control (Ctrl siRNA) and CDCP1 siRNA (siCDCP1); Two Ensembl (v90) annotated IL1RL1 transcript variants which encode soluble ST2 (sST2) and membrane-bound ST2 (ST2L). The red arrow indicates the exon which encodes the transmembrane domain of ST2L. RNA-seq reads mapped to the IL1RL1 exons which encode sST2, and those RNA-seq reads are significantly less in CDCP1 KD (siCDCP1) sample. (E) sST2 protein levels in HCF culture media quantified by ELISA assay. HCFs were transfected with siCDCP1 for KD (up left), CDCP1 cDNA plasmid for OE (up right), and treated with 20 ng/mL of PDGF-BB (down left), or 10 ng/uL of TGF-β1 (down right) for 48, 72 and 96 hours. For each group, three biological replicates were quantified at three time points (n=9). Data are presented as mean values ± S.D. Mann-Whitney test was used to calculate the presented p-values.