FIG 4.
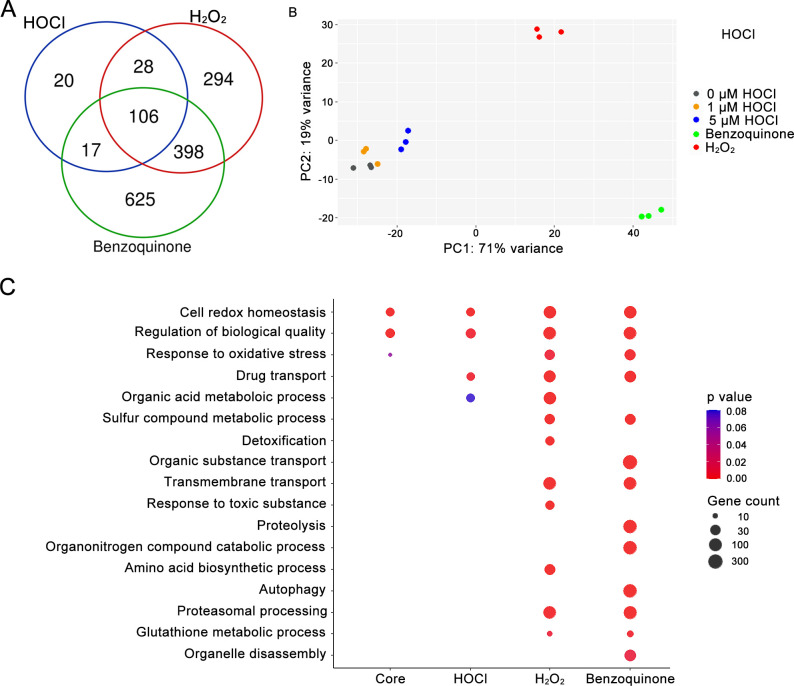
Transcriptomic analysis of C. albicans after exposure to HOCl, H2O2, or benzoquinone. (A) C. albicans WT cells were treated for 15 min with 5 µM HOCl, 5 µM H2O2, and 5 µM benzoquinone, respectively. The Venn diagram displays the number of upregulated genes (log2 fold change > 1, adjusted P value < 0.1). (B) Principal component analysis of the transcriptome. HOCl treatment samples (1 µM HOCl and 5 µM HOCl) clustered with the non-treatment control (0 µM HOCl). However, H2O2 and benzoquinone samples showed variable transcriptome patterns. Dots of the same color represent biological replicates. (C) Gene ontology (GO) term analysis of the upregulated genes under the indicated oxidative stress conditions. Core group genes were upregulated across all treatments, including HOCl, H2O2, and benzoquinone. Colors indicate statistical significance, and dot size represents the number of genes in the GO term.

